Cypriot vs Immigrants from Uruguay Male Unemployment
COMPARE
Cypriot
Immigrants from Uruguay
Male Unemployment
Male Unemployment Comparison
Cypriots
Immigrants from Uruguay
5.1%
MALE UNEMPLOYMENT
88.8/ 100
METRIC RATING
118th/ 347
METRIC RANK
5.2%
MALE UNEMPLOYMENT
73.9/ 100
METRIC RATING
153rd/ 347
METRIC RANK
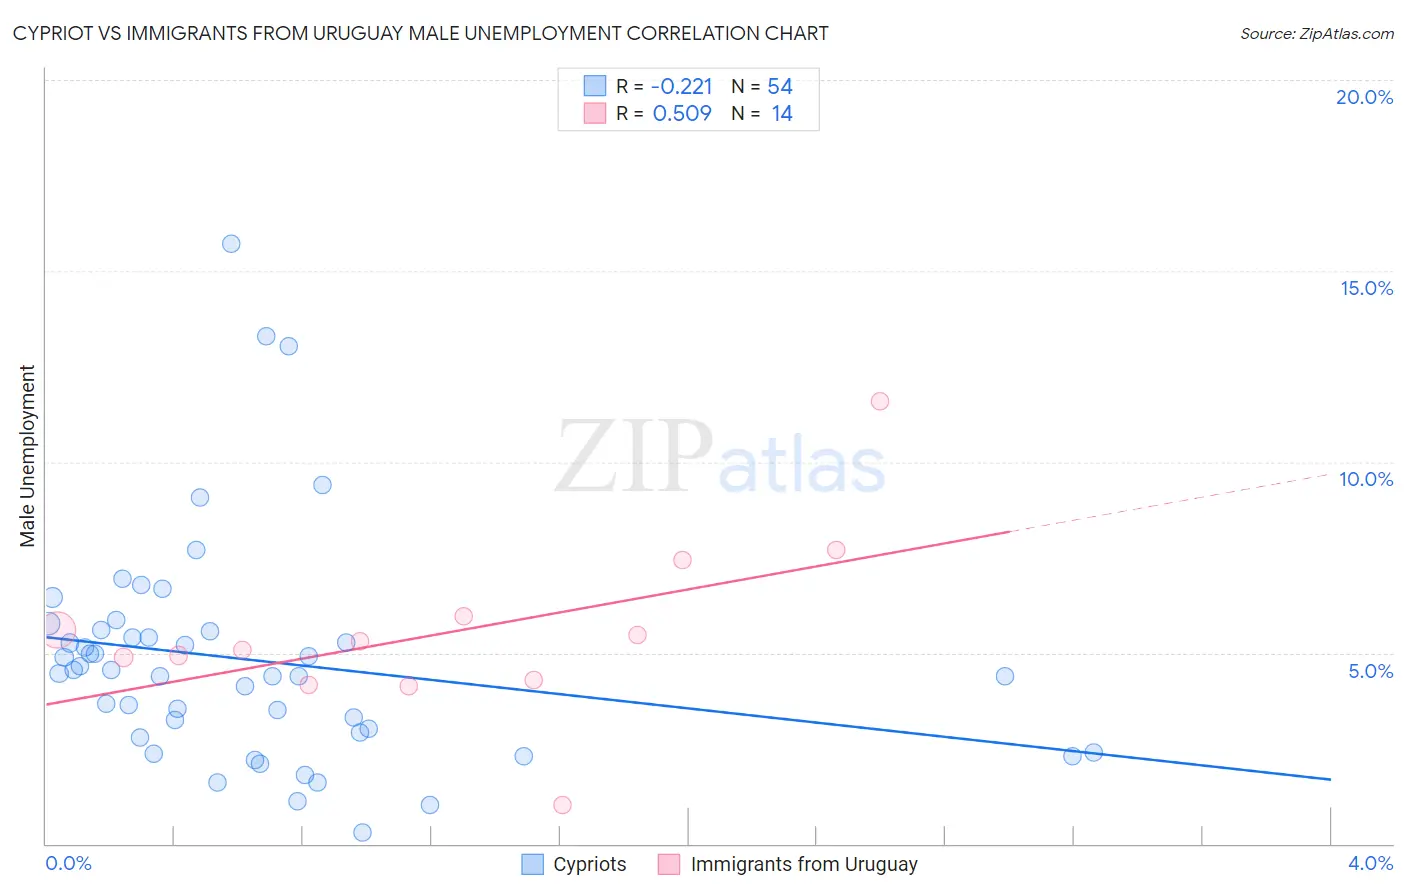
Cypriot vs Immigrants from Uruguay Male Unemployment Correlation Chart
The statistical analysis conducted on geographies consisting of 61,847,118 people shows a weak negative correlation between the proportion of Cypriots and unemployment rate among males in the United States with a correlation coefficient (R) of -0.221 and weighted average of 5.1%. Similarly, the statistical analysis conducted on geographies consisting of 133,186,426 people shows a substantial positive correlation between the proportion of Immigrants from Uruguay and unemployment rate among males in the United States with a correlation coefficient (R) of 0.509 and weighted average of 5.2%, a difference of 1.6%.
Male Unemployment Correlation Summary
| Measurement | Cypriot | Immigrants from Uruguay |
| Minimum | 0.30% | 1.0% |
| Maximum | 15.7% | 11.6% |
| Range | 15.4% | 10.6% |
| Mean | 4.8% | 5.5% |
| Median | 4.5% | 5.2% |
| Interquartile 25% (IQ1) | 2.9% | 4.3% |
| Interquartile 75% (IQ3) | 5.6% | 6.0% |
| Interquartile Range (IQR) | 2.7% | 1.7% |
| Standard Deviation (Sample) | 3.0% | 2.4% |
| Standard Deviation (Population) | 2.9% | 2.3% |
Similar Demographics by Male Unemployment
Demographics Similar to Cypriots by Male Unemployment
In terms of male unemployment, the demographic groups most similar to Cypriots are Estonian (5.1%, a difference of 0.030%), French Canadian (5.1%, a difference of 0.040%), Ukrainian (5.1%, a difference of 0.060%), Mongolian (5.1%, a difference of 0.070%), and Immigrants from Denmark (5.1%, a difference of 0.080%).
| Demographics | Rating | Rank | Male Unemployment |
| Immigrants | Eastern Asia | 90.8 /100 | #111 | Exceptional 5.1% |
| Immigrants | Moldova | 90.3 /100 | #112 | Exceptional 5.1% |
| Immigrants | Austria | 90.3 /100 | #113 | Exceptional 5.1% |
| Romanians | 89.8 /100 | #114 | Excellent 5.1% |
| Immigrants | Asia | 89.6 /100 | #115 | Excellent 5.1% |
| Immigrants | Denmark | 89.4 /100 | #116 | Excellent 5.1% |
| Estonians | 89.0 /100 | #117 | Excellent 5.1% |
| Cypriots | 88.8 /100 | #118 | Excellent 5.1% |
| French Canadians | 88.6 /100 | #119 | Excellent 5.1% |
| Ukrainians | 88.4 /100 | #120 | Excellent 5.1% |
| Mongolians | 88.4 /100 | #121 | Excellent 5.1% |
| Nicaraguans | 88.2 /100 | #122 | Excellent 5.1% |
| Palestinians | 87.7 /100 | #123 | Excellent 5.1% |
| Immigrants | Latvia | 87.5 /100 | #124 | Excellent 5.1% |
| Immigrants | Lithuania | 87.2 /100 | #125 | Excellent 5.1% |
Demographics Similar to Immigrants from Uruguay by Male Unemployment
In terms of male unemployment, the demographic groups most similar to Immigrants from Uruguay are Laotian (5.2%, a difference of 0.010%), Immigrants from Hungary (5.2%, a difference of 0.040%), Egyptian (5.2%, a difference of 0.070%), American (5.2%, a difference of 0.090%), and Immigrants from Northern Africa (5.2%, a difference of 0.12%).
| Demographics | Rating | Rank | Male Unemployment |
| Immigrants | Kenya | 77.6 /100 | #146 | Good 5.2% |
| Immigrants | Burma/Myanmar | 77.5 /100 | #147 | Good 5.2% |
| Immigrants | Italy | 76.3 /100 | #148 | Good 5.2% |
| Immigrants | Europe | 76.2 /100 | #149 | Good 5.2% |
| Indians (Asian) | 76.0 /100 | #150 | Good 5.2% |
| Slovaks | 75.5 /100 | #151 | Good 5.2% |
| Egyptians | 74.8 /100 | #152 | Good 5.2% |
| Immigrants | Uruguay | 73.9 /100 | #153 | Good 5.2% |
| Laotians | 73.8 /100 | #154 | Good 5.2% |
| Immigrants | Hungary | 73.4 /100 | #155 | Good 5.2% |
| Americans | 72.7 /100 | #156 | Good 5.2% |
| Immigrants | Northern Africa | 72.3 /100 | #157 | Good 5.2% |
| Immigrants | Indonesia | 71.5 /100 | #158 | Good 5.2% |
| Indonesians | 71.2 /100 | #159 | Good 5.2% |
| Immigrants | Norway | 71.0 /100 | #160 | Good 5.2% |