Cypriot vs Korean Male Unemployment
COMPARE
Cypriot
Korean
Male Unemployment
Male Unemployment Comparison
Cypriots
Koreans
5.1%
MALE UNEMPLOYMENT
88.8/ 100
METRIC RATING
118th/ 347
METRIC RANK
5.3%
MALE UNEMPLOYMENT
34.9/ 100
METRIC RATING
185th/ 347
METRIC RANK
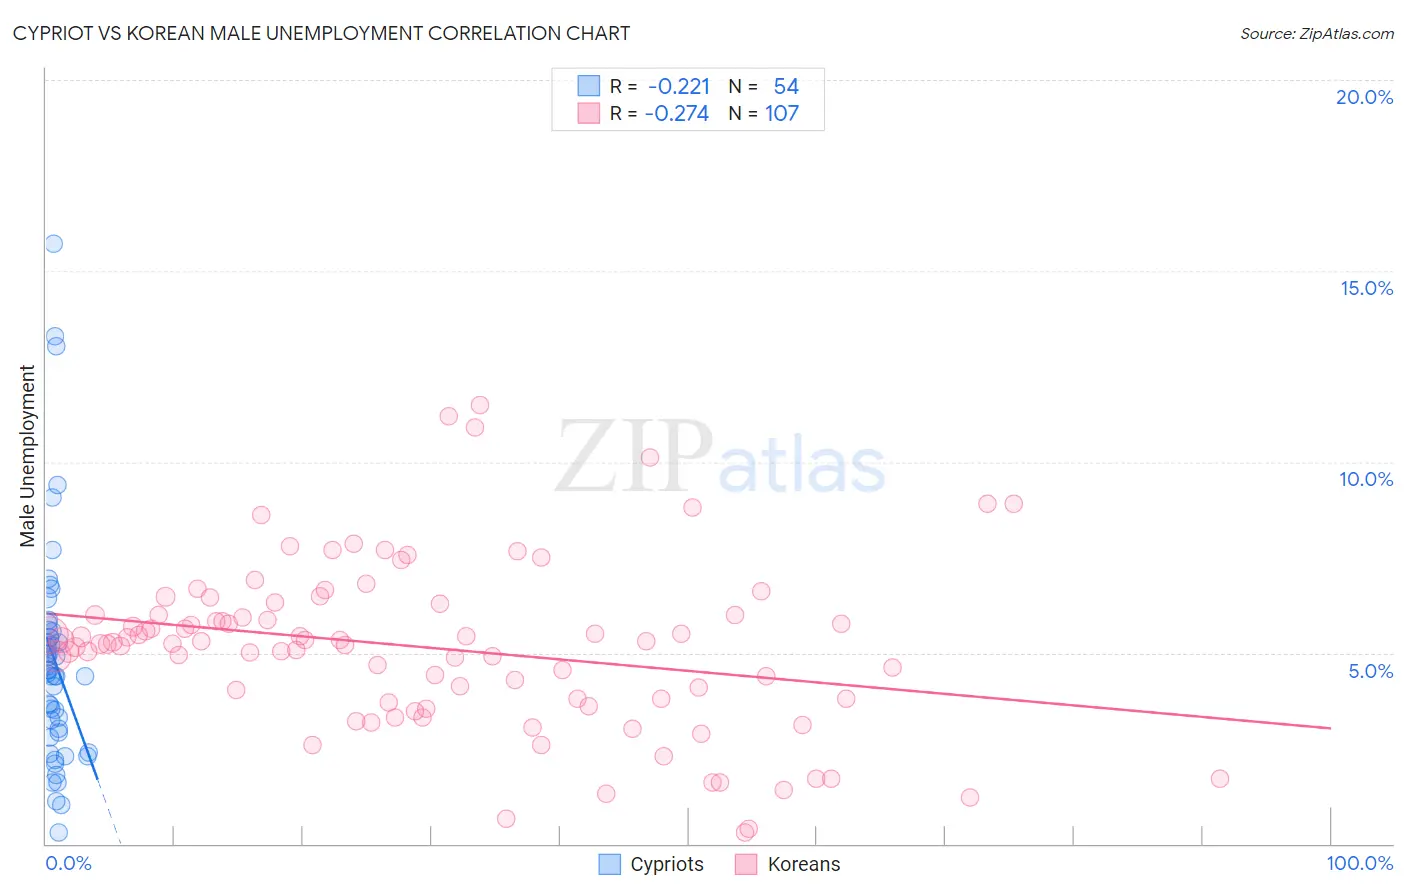
Cypriot vs Korean Male Unemployment Correlation Chart
The statistical analysis conducted on geographies consisting of 61,847,118 people shows a weak negative correlation between the proportion of Cypriots and unemployment rate among males in the United States with a correlation coefficient (R) of -0.221 and weighted average of 5.1%. Similarly, the statistical analysis conducted on geographies consisting of 506,883,728 people shows a weak negative correlation between the proportion of Koreans and unemployment rate among males in the United States with a correlation coefficient (R) of -0.274 and weighted average of 5.3%, a difference of 4.1%.
Male Unemployment Correlation Summary
| Measurement | Cypriot | Korean |
| Minimum | 0.30% | 0.30% |
| Maximum | 15.7% | 11.5% |
| Range | 15.4% | 11.2% |
| Mean | 4.8% | 5.1% |
| Median | 4.5% | 5.3% |
| Interquartile 25% (IQ1) | 2.9% | 3.8% |
| Interquartile 75% (IQ3) | 5.6% | 6.0% |
| Interquartile Range (IQR) | 2.7% | 2.2% |
| Standard Deviation (Sample) | 3.0% | 2.2% |
| Standard Deviation (Population) | 2.9% | 2.2% |
Similar Demographics by Male Unemployment
Demographics Similar to Cypriots by Male Unemployment
In terms of male unemployment, the demographic groups most similar to Cypriots are Estonian (5.1%, a difference of 0.030%), French Canadian (5.1%, a difference of 0.040%), Ukrainian (5.1%, a difference of 0.060%), Mongolian (5.1%, a difference of 0.070%), and Immigrants from Denmark (5.1%, a difference of 0.080%).
| Demographics | Rating | Rank | Male Unemployment |
| Immigrants | Eastern Asia | 90.8 /100 | #111 | Exceptional 5.1% |
| Immigrants | Moldova | 90.3 /100 | #112 | Exceptional 5.1% |
| Immigrants | Austria | 90.3 /100 | #113 | Exceptional 5.1% |
| Romanians | 89.8 /100 | #114 | Excellent 5.1% |
| Immigrants | Asia | 89.6 /100 | #115 | Excellent 5.1% |
| Immigrants | Denmark | 89.4 /100 | #116 | Excellent 5.1% |
| Estonians | 89.0 /100 | #117 | Excellent 5.1% |
| Cypriots | 88.8 /100 | #118 | Excellent 5.1% |
| French Canadians | 88.6 /100 | #119 | Excellent 5.1% |
| Ukrainians | 88.4 /100 | #120 | Excellent 5.1% |
| Mongolians | 88.4 /100 | #121 | Excellent 5.1% |
| Nicaraguans | 88.2 /100 | #122 | Excellent 5.1% |
| Palestinians | 87.7 /100 | #123 | Excellent 5.1% |
| Immigrants | Latvia | 87.5 /100 | #124 | Excellent 5.1% |
| Immigrants | Lithuania | 87.2 /100 | #125 | Excellent 5.1% |
Demographics Similar to Koreans by Male Unemployment
In terms of male unemployment, the demographic groups most similar to Koreans are Spaniard (5.3%, a difference of 0.010%), Taiwanese (5.3%, a difference of 0.17%), Potawatomi (5.3%, a difference of 0.18%), Immigrants from Afghanistan (5.3%, a difference of 0.19%), and Iraqi (5.4%, a difference of 0.22%).
| Demographics | Rating | Rank | Male Unemployment |
| Osage | 42.5 /100 | #178 | Average 5.3% |
| Immigrants | Oceania | 40.8 /100 | #179 | Average 5.3% |
| Malaysians | 39.6 /100 | #180 | Fair 5.3% |
| Immigrants | Afghanistan | 37.9 /100 | #181 | Fair 5.3% |
| Potawatomi | 37.8 /100 | #182 | Fair 5.3% |
| Taiwanese | 37.6 /100 | #183 | Fair 5.3% |
| Spaniards | 35.1 /100 | #184 | Fair 5.3% |
| Koreans | 34.9 /100 | #185 | Fair 5.3% |
| Iraqis | 31.6 /100 | #186 | Fair 5.4% |
| Costa Ricans | 31.3 /100 | #187 | Fair 5.4% |
| Arabs | 30.2 /100 | #188 | Fair 5.4% |
| Immigrants | South America | 29.4 /100 | #189 | Fair 5.4% |
| Immigrants | Uganda | 28.8 /100 | #190 | Fair 5.4% |
| Immigrants | South Eastern Asia | 28.2 /100 | #191 | Fair 5.4% |
| Immigrants | Belarus | 26.0 /100 | #192 | Fair 5.4% |