Black/African American vs Ute Unemployment Among Seniors over 65 years
COMPARE
Black/African American
Ute
Unemployment Among Seniors over 65 years
Unemployment Among Seniors over 65 years Comparison
Blacks/African Americans
Ute
5.5%
UNEMPLOYMENT AMONG SENIORS OVER 65 YEARS
0.0/ 100
METRIC RATING
291st/ 347
METRIC RANK
6.3%
UNEMPLOYMENT AMONG SENIORS OVER 65 YEARS
0.0/ 100
METRIC RATING
340th/ 347
METRIC RANK
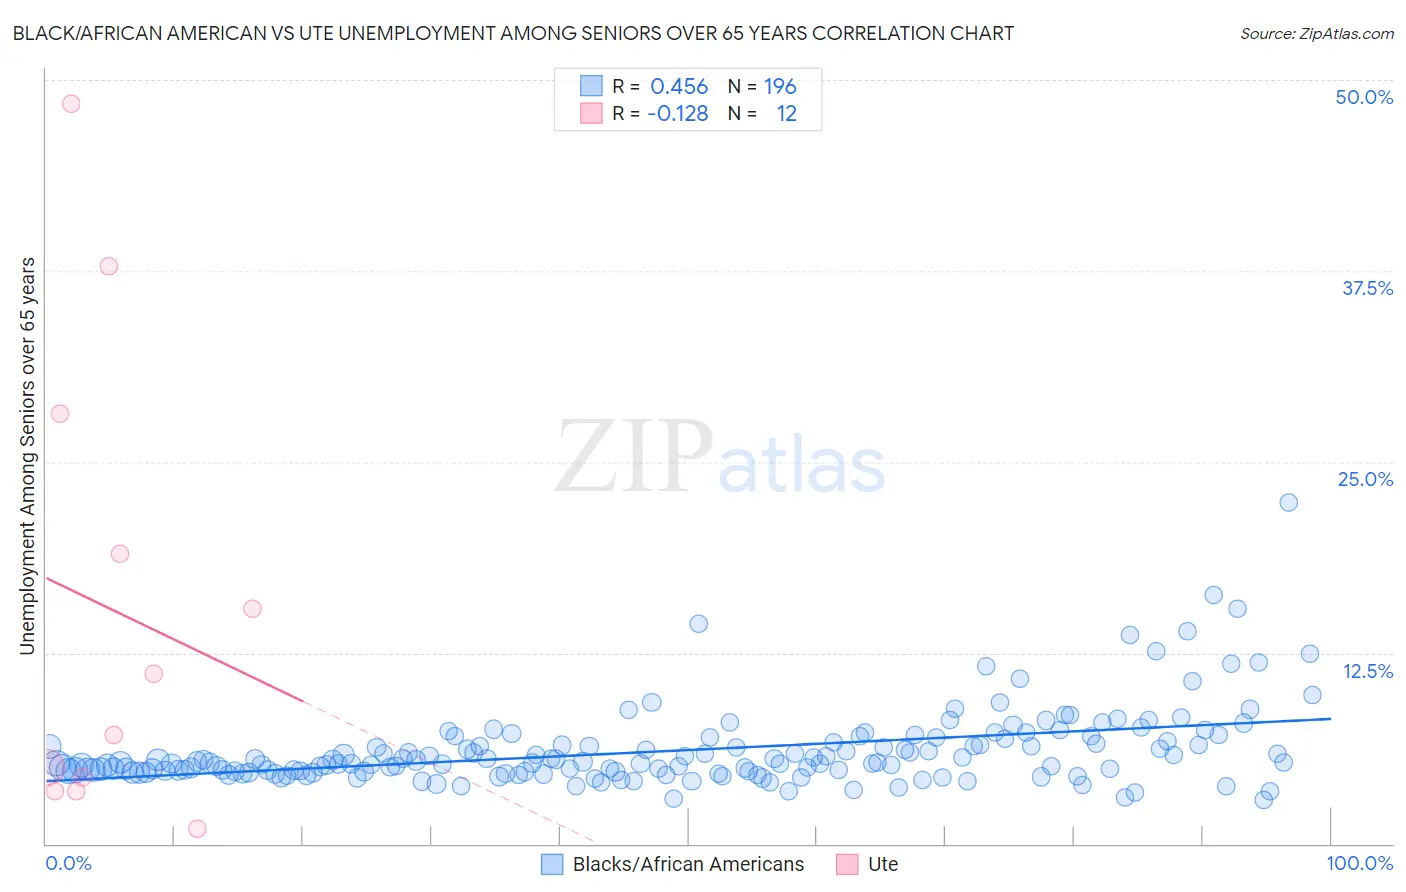
Black/African American vs Ute Unemployment Among Seniors over 65 years Correlation Chart
The statistical analysis conducted on geographies consisting of 461,286,311 people shows a moderate positive correlation between the proportion of Blacks/African Americans and unemployment rate amomg seniors over the age of 65 in the United States with a correlation coefficient (R) of 0.456 and weighted average of 5.5%. Similarly, the statistical analysis conducted on geographies consisting of 53,343,096 people shows a poor negative correlation between the proportion of Ute and unemployment rate amomg seniors over the age of 65 in the United States with a correlation coefficient (R) of -0.128 and weighted average of 6.3%, a difference of 14.5%.
Unemployment Among Seniors over 65 years Correlation Summary
| Measurement | Black/African American | Ute |
| Minimum | 2.9% | 1.0% |
| Maximum | 22.3% | 48.4% |
| Range | 19.4% | 47.4% |
| Mean | 6.1% | 15.4% |
| Median | 5.3% | 9.1% |
| Interquartile 25% (IQ1) | 4.7% | 3.9% |
| Interquartile 75% (IQ3) | 6.6% | 23.6% |
| Interquartile Range (IQR) | 1.9% | 19.7% |
| Standard Deviation (Sample) | 2.5% | 15.3% |
| Standard Deviation (Population) | 2.5% | 14.7% |
Similar Demographics by Unemployment Among Seniors over 65 years
Demographics Similar to Blacks/African Americans by Unemployment Among Seniors over 65 years
In terms of unemployment among seniors over 65 years, the demographic groups most similar to Blacks/African Americans are Jamaican (5.5%, a difference of 0.030%), Belizean (5.5%, a difference of 0.15%), Immigrants from Venezuela (5.5%, a difference of 0.19%), Armenian (5.5%, a difference of 0.23%), and Cheyenne (5.5%, a difference of 0.30%).
| Demographics | Rating | Rank | Unemployment Among Seniors over 65 years |
| Immigrants | Liberia | 0.0 /100 | #284 | Tragic 5.5% |
| Central Americans | 0.0 /100 | #285 | Tragic 5.5% |
| Immigrants | Barbados | 0.0 /100 | #286 | Tragic 5.5% |
| Venezuelans | 0.0 /100 | #287 | Tragic 5.5% |
| U.S. Virgin Islanders | 0.0 /100 | #288 | Tragic 5.5% |
| Immigrants | Cabo Verde | 0.0 /100 | #289 | Tragic 5.5% |
| Jamaicans | 0.0 /100 | #290 | Tragic 5.5% |
| Blacks/African Americans | 0.0 /100 | #291 | Tragic 5.5% |
| Belizeans | 0.0 /100 | #292 | Tragic 5.5% |
| Immigrants | Venezuela | 0.0 /100 | #293 | Tragic 5.5% |
| Armenians | 0.0 /100 | #294 | Tragic 5.5% |
| Cheyenne | 0.0 /100 | #295 | Tragic 5.5% |
| Cape Verdeans | 0.0 /100 | #296 | Tragic 5.5% |
| Yaqui | 0.0 /100 | #297 | Tragic 5.5% |
| Immigrants | West Indies | 0.0 /100 | #298 | Tragic 5.6% |
Demographics Similar to Ute by Unemployment Among Seniors over 65 years
In terms of unemployment among seniors over 65 years, the demographic groups most similar to Ute are Paiute (6.3%, a difference of 0.060%), Immigrants from the Azores (6.3%, a difference of 0.33%), Alaska Native (6.3%, a difference of 0.50%), Pima (6.3%, a difference of 1.1%), and Immigrants from Armenia (6.2%, a difference of 2.9%).
| Demographics | Rating | Rank | Unemployment Among Seniors over 65 years |
| Immigrants | Dominican Republic | 0.0 /100 | #333 | Tragic 6.0% |
| Tohono O'odham | 0.0 /100 | #334 | Tragic 6.1% |
| Immigrants | Armenia | 0.0 /100 | #335 | Tragic 6.2% |
| Pima | 0.0 /100 | #336 | Tragic 6.3% |
| Alaska Natives | 0.0 /100 | #337 | Tragic 6.3% |
| Immigrants | Azores | 0.0 /100 | #338 | Tragic 6.3% |
| Paiute | 0.0 /100 | #339 | Tragic 6.3% |
| Ute | 0.0 /100 | #340 | Tragic 6.3% |
| Yakama | 0.0 /100 | #341 | Tragic 6.7% |
| Navajo | 0.0 /100 | #342 | Tragic 6.7% |
| Tlingit-Haida | 0.0 /100 | #343 | Tragic 6.8% |
| Alaskan Athabascans | 0.0 /100 | #344 | Tragic 7.0% |
| Immigrants | Yemen | 0.0 /100 | #345 | Tragic 8.2% |
| Yup'ik | 0.0 /100 | #346 | Tragic 9.1% |
| Crow | 0.0 /100 | #347 | Tragic 16.9% |