Tsimshian vs Ute Unemployment Among Seniors over 65 years
COMPARE
Tsimshian
Ute
Unemployment Among Seniors over 65 years
Unemployment Among Seniors over 65 years Comparison
Tsimshian
Ute
4.5%
UNEMPLOYMENT AMONG SENIORS OVER 65 YEARS
100.0/ 100
METRIC RATING
8th/ 347
METRIC RANK
6.3%
UNEMPLOYMENT AMONG SENIORS OVER 65 YEARS
0.0/ 100
METRIC RATING
340th/ 347
METRIC RANK
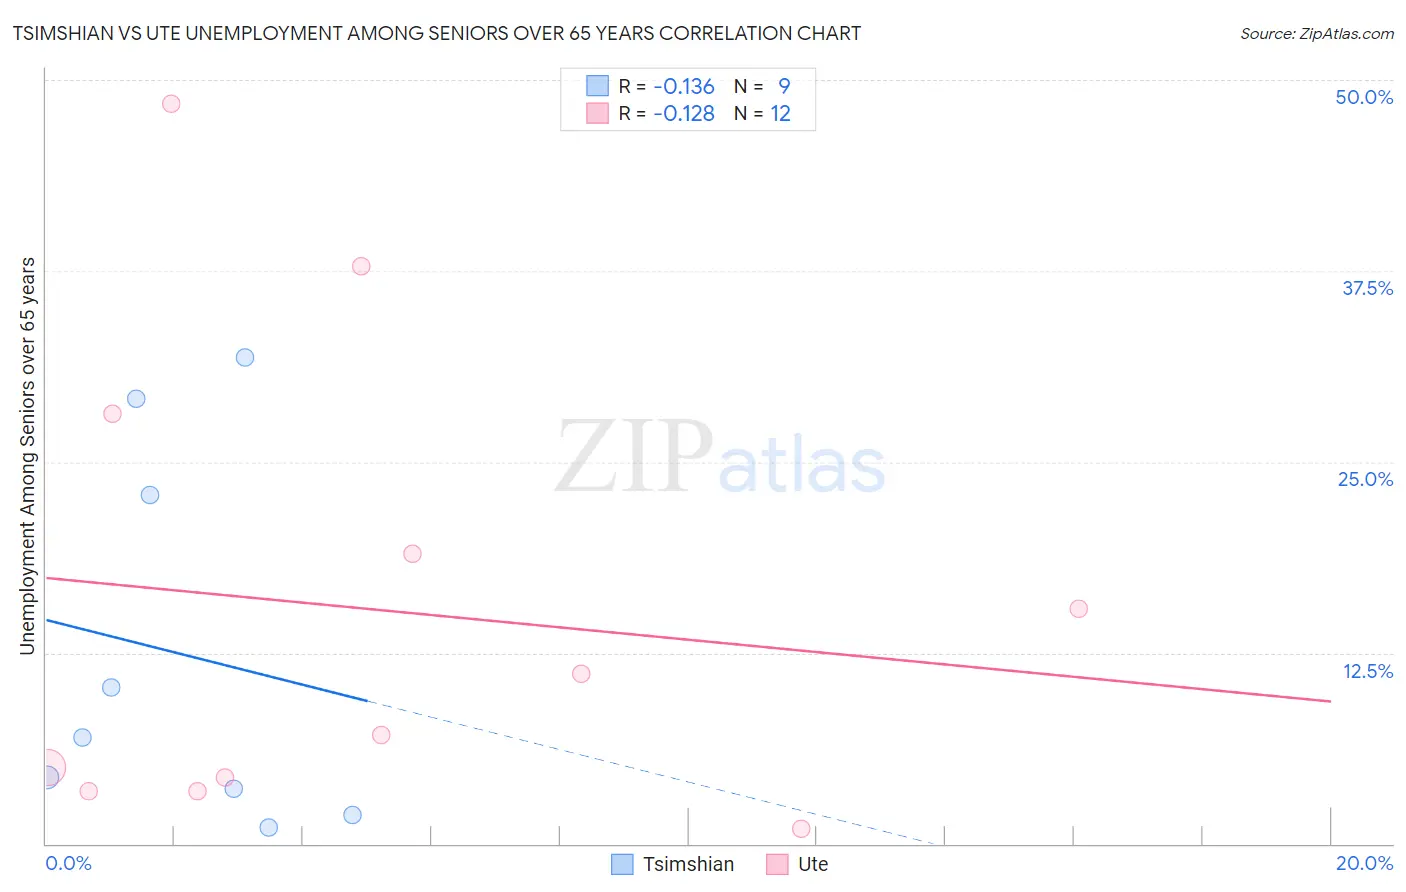
Tsimshian vs Ute Unemployment Among Seniors over 65 years Correlation Chart
The statistical analysis conducted on geographies consisting of 15,009,630 people shows a poor negative correlation between the proportion of Tsimshian and unemployment rate amomg seniors over the age of 65 in the United States with a correlation coefficient (R) of -0.136 and weighted average of 4.5%. Similarly, the statistical analysis conducted on geographies consisting of 53,343,096 people shows a poor negative correlation between the proportion of Ute and unemployment rate amomg seniors over the age of 65 in the United States with a correlation coefficient (R) of -0.128 and weighted average of 6.3%, a difference of 40.0%.
Unemployment Among Seniors over 65 years Correlation Summary
| Measurement | Tsimshian | Ute |
| Minimum | 1.1% | 1.0% |
| Maximum | 31.8% | 48.4% |
| Range | 30.7% | 47.4% |
| Mean | 12.4% | 15.4% |
| Median | 6.9% | 9.1% |
| Interquartile 25% (IQ1) | 2.8% | 3.9% |
| Interquartile 75% (IQ3) | 26.0% | 23.6% |
| Interquartile Range (IQR) | 23.2% | 19.7% |
| Standard Deviation (Sample) | 12.1% | 15.3% |
| Standard Deviation (Population) | 11.4% | 14.7% |
Similar Demographics by Unemployment Among Seniors over 65 years
Demographics Similar to Tsimshian by Unemployment Among Seniors over 65 years
In terms of unemployment among seniors over 65 years, the demographic groups most similar to Tsimshian are Indonesian (4.5%, a difference of 0.49%), Immigrants from Zaire (4.5%, a difference of 0.50%), Immigrants from Congo (4.5%, a difference of 0.59%), Comanche (4.6%, a difference of 0.91%), and Immigrants from Cuba (4.5%, a difference of 1.4%).
| Demographics | Rating | Rank | Unemployment Among Seniors over 65 years |
| Chinese | 100.0 /100 | #1 | Exceptional 4.2% |
| Hmong | 100.0 /100 | #2 | Exceptional 4.2% |
| Fijians | 100.0 /100 | #3 | Exceptional 4.2% |
| Sudanese | 100.0 /100 | #4 | Exceptional 4.4% |
| Chickasaw | 100.0 /100 | #5 | Exceptional 4.4% |
| Immigrants | Cuba | 100.0 /100 | #6 | Exceptional 4.5% |
| Immigrants | Congo | 100.0 /100 | #7 | Exceptional 4.5% |
| Tsimshian | 100.0 /100 | #8 | Exceptional 4.5% |
| Indonesians | 100.0 /100 | #9 | Exceptional 4.5% |
| Immigrants | Zaire | 100.0 /100 | #10 | Exceptional 4.5% |
| Comanche | 100.0 /100 | #11 | Exceptional 4.6% |
| Osage | 100.0 /100 | #12 | Exceptional 4.6% |
| Cubans | 100.0 /100 | #13 | Exceptional 4.6% |
| Menominee | 100.0 /100 | #14 | Exceptional 4.6% |
| Lumbee | 100.0 /100 | #15 | Exceptional 4.6% |
Demographics Similar to Ute by Unemployment Among Seniors over 65 years
In terms of unemployment among seniors over 65 years, the demographic groups most similar to Ute are Paiute (6.3%, a difference of 0.060%), Immigrants from the Azores (6.3%, a difference of 0.33%), Alaska Native (6.3%, a difference of 0.50%), Pima (6.3%, a difference of 1.1%), and Immigrants from Armenia (6.2%, a difference of 2.9%).
| Demographics | Rating | Rank | Unemployment Among Seniors over 65 years |
| Immigrants | Dominican Republic | 0.0 /100 | #333 | Tragic 6.0% |
| Tohono O'odham | 0.0 /100 | #334 | Tragic 6.1% |
| Immigrants | Armenia | 0.0 /100 | #335 | Tragic 6.2% |
| Pima | 0.0 /100 | #336 | Tragic 6.3% |
| Alaska Natives | 0.0 /100 | #337 | Tragic 6.3% |
| Immigrants | Azores | 0.0 /100 | #338 | Tragic 6.3% |
| Paiute | 0.0 /100 | #339 | Tragic 6.3% |
| Ute | 0.0 /100 | #340 | Tragic 6.3% |
| Yakama | 0.0 /100 | #341 | Tragic 6.7% |
| Navajo | 0.0 /100 | #342 | Tragic 6.7% |
| Tlingit-Haida | 0.0 /100 | #343 | Tragic 6.8% |
| Alaskan Athabascans | 0.0 /100 | #344 | Tragic 7.0% |
| Immigrants | Yemen | 0.0 /100 | #345 | Tragic 8.2% |
| Yup'ik | 0.0 /100 | #346 | Tragic 9.1% |
| Crow | 0.0 /100 | #347 | Tragic 16.9% |