Black/African American vs Ute Unemployment Among Ages 16 to 19 years
COMPARE
Black/African American
Ute
Unemployment Among Ages 16 to 19 years
Unemployment Among Ages 16 to 19 years Comparison
Blacks/African Americans
Ute
21.4%
UNEMPLOYMENT AMONG AGES 16 TO 19 YEARS
0.0/ 100
METRIC RATING
307th/ 347
METRIC RANK
19.6%
UNEMPLOYMENT AMONG AGES 16 TO 19 YEARS
0.0/ 100
METRIC RATING
279th/ 347
METRIC RANK
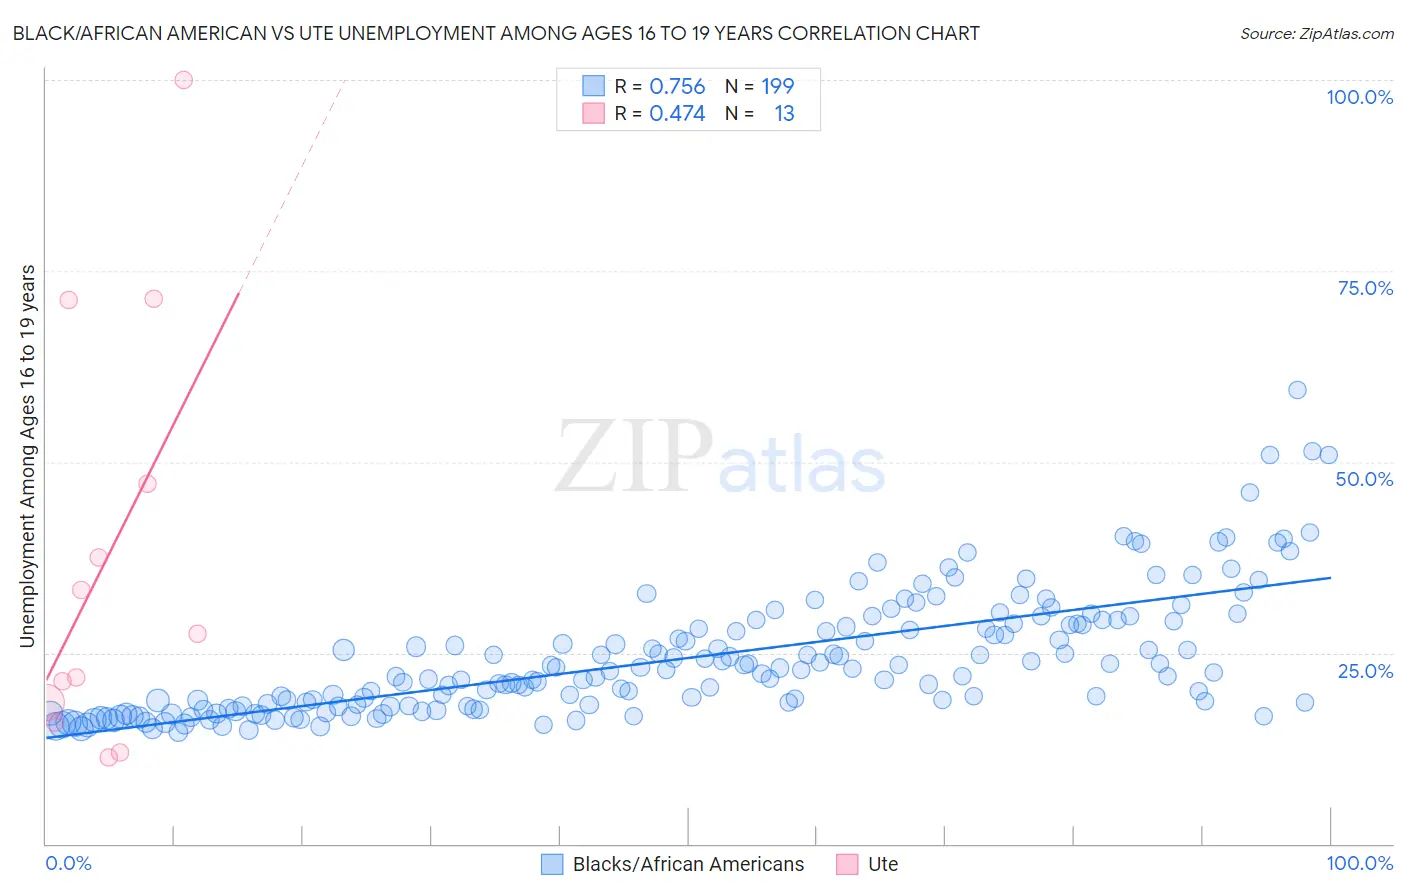
Black/African American vs Ute Unemployment Among Ages 16 to 19 years Correlation Chart
The statistical analysis conducted on geographies consisting of 508,068,694 people shows a strong positive correlation between the proportion of Blacks/African Americans and unemployment rate among population between the ages 16 and 19 in the United States with a correlation coefficient (R) of 0.756 and weighted average of 21.4%. Similarly, the statistical analysis conducted on geographies consisting of 55,217,994 people shows a moderate positive correlation between the proportion of Ute and unemployment rate among population between the ages 16 and 19 in the United States with a correlation coefficient (R) of 0.474 and weighted average of 19.6%, a difference of 9.4%.
Unemployment Among Ages 16 to 19 years Correlation Summary
| Measurement | Black/African American | Ute |
| Minimum | 14.6% | 11.3% |
| Maximum | 59.4% | 100.0% |
| Range | 44.7% | 88.7% |
| Mean | 24.3% | 37.6% |
| Median | 22.4% | 27.5% |
| Interquartile 25% (IQ1) | 18.0% | 17.1% |
| Interquartile 75% (IQ3) | 28.6% | 59.1% |
| Interquartile Range (IQR) | 10.6% | 42.0% |
| Standard Deviation (Sample) | 8.0% | 27.5% |
| Standard Deviation (Population) | 8.0% | 26.4% |
Similar Demographics by Unemployment Among Ages 16 to 19 years
Demographics Similar to Blacks/African Americans by Unemployment Among Ages 16 to 19 years
In terms of unemployment among ages 16 to 19 years, the demographic groups most similar to Blacks/African Americans are Immigrants from Bangladesh (21.5%, a difference of 0.38%), Native/Alaskan (21.5%, a difference of 0.54%), U.S. Virgin Islander (21.3%, a difference of 0.58%), Vietnamese (21.5%, a difference of 0.60%), and Belizean (21.6%, a difference of 0.82%).
| Demographics | Rating | Rank | Unemployment Among Ages 16 to 19 years |
| Ecuadorians | 0.0 /100 | #300 | Tragic 20.5% |
| Immigrants | Ecuador | 0.0 /100 | #301 | Tragic 20.9% |
| Immigrants | Caribbean | 0.0 /100 | #302 | Tragic 20.9% |
| Senegalese | 0.0 /100 | #303 | Tragic 21.0% |
| Aleuts | 0.0 /100 | #304 | Tragic 21.2% |
| Immigrants | Senegal | 0.0 /100 | #305 | Tragic 21.2% |
| U.S. Virgin Islanders | 0.0 /100 | #306 | Tragic 21.3% |
| Blacks/African Americans | 0.0 /100 | #307 | Tragic 21.4% |
| Immigrants | Bangladesh | 0.0 /100 | #308 | Tragic 21.5% |
| Natives/Alaskans | 0.0 /100 | #309 | Tragic 21.5% |
| Vietnamese | 0.0 /100 | #310 | Tragic 21.5% |
| Belizeans | 0.0 /100 | #311 | Tragic 21.6% |
| Houma | 0.0 /100 | #312 | Tragic 21.6% |
| Jamaicans | 0.0 /100 | #313 | Tragic 21.7% |
| Alaska Natives | 0.0 /100 | #314 | Tragic 21.8% |
Demographics Similar to Ute by Unemployment Among Ages 16 to 19 years
In terms of unemployment among ages 16 to 19 years, the demographic groups most similar to Ute are Cajun (19.6%, a difference of 0.12%), Cypriot (19.6%, a difference of 0.30%), African (19.5%, a difference of 0.37%), Immigrants from Western Africa (19.4%, a difference of 0.60%), and Dutch West Indian (19.7%, a difference of 0.74%).
| Demographics | Rating | Rank | Unemployment Among Ages 16 to 19 years |
| Hispanics or Latinos | 0.0 /100 | #272 | Tragic 19.2% |
| Immigrants | Panama | 0.0 /100 | #273 | Tragic 19.3% |
| Shoshone | 0.0 /100 | #274 | Tragic 19.3% |
| Paraguayans | 0.0 /100 | #275 | Tragic 19.4% |
| Immigrants | Latin America | 0.0 /100 | #276 | Tragic 19.4% |
| Immigrants | Western Africa | 0.0 /100 | #277 | Tragic 19.4% |
| Africans | 0.0 /100 | #278 | Tragic 19.5% |
| Ute | 0.0 /100 | #279 | Tragic 19.6% |
| Cajuns | 0.0 /100 | #280 | Tragic 19.6% |
| Cypriots | 0.0 /100 | #281 | Tragic 19.6% |
| Dutch West Indians | 0.0 /100 | #282 | Tragic 19.7% |
| Sioux | 0.0 /100 | #283 | Tragic 19.7% |
| Sierra Leoneans | 0.0 /100 | #284 | Tragic 19.7% |
| Ghanaians | 0.0 /100 | #285 | Tragic 19.8% |
| Bahamians | 0.0 /100 | #286 | Tragic 19.8% |