Black/African American vs Immigrants from Guyana Unemployment Among Seniors over 65 years
COMPARE
Black/African American
Immigrants from Guyana
Unemployment Among Seniors over 65 years
Unemployment Among Seniors over 65 years Comparison
Blacks/African Americans
Immigrants from Guyana
5.5%
UNEMPLOYMENT AMONG SENIORS OVER 65 YEARS
0.0/ 100
METRIC RATING
291st/ 347
METRIC RANK
5.6%
UNEMPLOYMENT AMONG SENIORS OVER 65 YEARS
0.0/ 100
METRIC RATING
311th/ 347
METRIC RANK
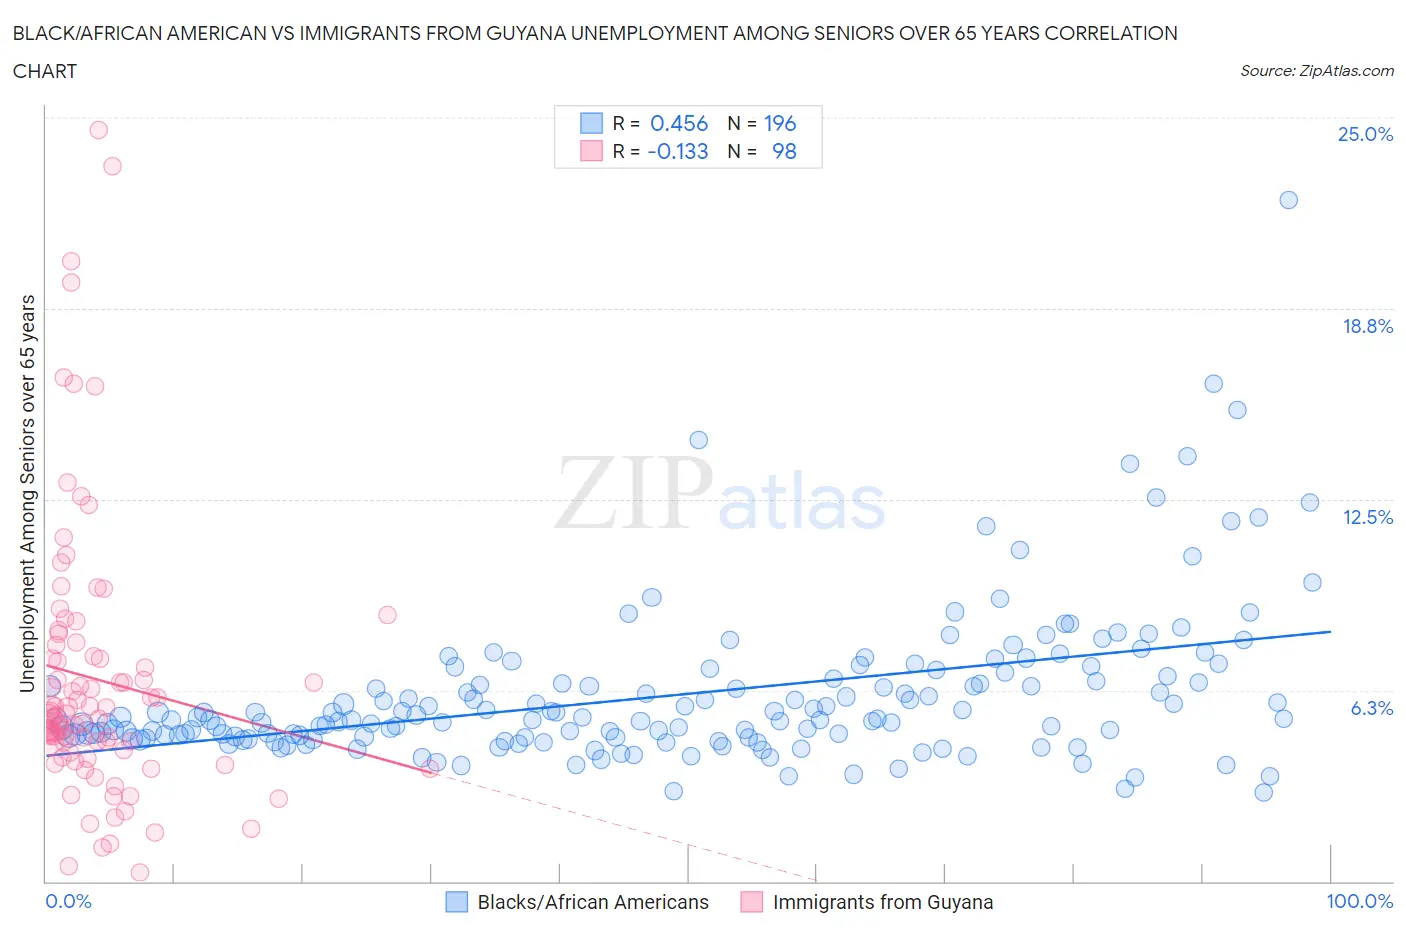
Black/African American vs Immigrants from Guyana Unemployment Among Seniors over 65 years Correlation Chart
The statistical analysis conducted on geographies consisting of 461,286,311 people shows a moderate positive correlation between the proportion of Blacks/African Americans and unemployment rate amomg seniors over the age of 65 in the United States with a correlation coefficient (R) of 0.456 and weighted average of 5.5%. Similarly, the statistical analysis conducted on geographies consisting of 174,172,541 people shows a poor negative correlation between the proportion of Immigrants from Guyana and unemployment rate amomg seniors over the age of 65 in the United States with a correlation coefficient (R) of -0.133 and weighted average of 5.6%, a difference of 1.8%.
Unemployment Among Seniors over 65 years Correlation Summary
| Measurement | Black/African American | Immigrants from Guyana |
| Minimum | 2.9% | 0.30% |
| Maximum | 22.3% | 24.6% |
| Range | 19.4% | 24.3% |
| Mean | 6.1% | 6.6% |
| Median | 5.3% | 5.5% |
| Interquartile 25% (IQ1) | 4.7% | 4.3% |
| Interquartile 75% (IQ3) | 6.6% | 7.4% |
| Interquartile Range (IQR) | 1.9% | 3.1% |
| Standard Deviation (Sample) | 2.5% | 4.5% |
| Standard Deviation (Population) | 2.5% | 4.5% |
Demographics Similar to Blacks/African Americans and Immigrants from Guyana by Unemployment Among Seniors over 65 years
In terms of unemployment among seniors over 65 years, the demographic groups most similar to Blacks/African Americans are Belizean (5.5%, a difference of 0.15%), Immigrants from Venezuela (5.5%, a difference of 0.19%), Armenian (5.5%, a difference of 0.23%), Cheyenne (5.5%, a difference of 0.30%), and Cape Verdean (5.5%, a difference of 0.30%). Similarly, the demographic groups most similar to Immigrants from Guyana are Salvadoran (5.6%, a difference of 0.14%), Immigrants from Guatemala (5.6%, a difference of 0.18%), Immigrants from St. Vincent and the Grenadines (5.6%, a difference of 0.39%), Portuguese (5.6%, a difference of 0.48%), and Ecuadorian (5.6%, a difference of 0.53%).
| Demographics | Rating | Rank | Unemployment Among Seniors over 65 years |
| Blacks/African Americans | 0.0 /100 | #291 | Tragic 5.5% |
| Belizeans | 0.0 /100 | #292 | Tragic 5.5% |
| Immigrants | Venezuela | 0.0 /100 | #293 | Tragic 5.5% |
| Armenians | 0.0 /100 | #294 | Tragic 5.5% |
| Cheyenne | 0.0 /100 | #295 | Tragic 5.5% |
| Cape Verdeans | 0.0 /100 | #296 | Tragic 5.5% |
| Yaqui | 0.0 /100 | #297 | Tragic 5.5% |
| Immigrants | West Indies | 0.0 /100 | #298 | Tragic 5.6% |
| Guyanese | 0.0 /100 | #299 | Tragic 5.6% |
| Zimbabweans | 0.0 /100 | #300 | Tragic 5.6% |
| Hispanics or Latinos | 0.0 /100 | #301 | Tragic 5.6% |
| Guatemalans | 0.0 /100 | #302 | Tragic 5.6% |
| Immigrants | Latin America | 0.0 /100 | #303 | Tragic 5.6% |
| Liberians | 0.0 /100 | #304 | Tragic 5.6% |
| Mexicans | 0.0 /100 | #305 | Tragic 5.6% |
| Ecuadorians | 0.0 /100 | #306 | Tragic 5.6% |
| Portuguese | 0.0 /100 | #307 | Tragic 5.6% |
| Immigrants | St. Vincent and the Grenadines | 0.0 /100 | #308 | Tragic 5.6% |
| Immigrants | Guatemala | 0.0 /100 | #309 | Tragic 5.6% |
| Salvadorans | 0.0 /100 | #310 | Tragic 5.6% |
| Immigrants | Guyana | 0.0 /100 | #311 | Tragic 5.6% |