Black/African American vs Immigrants from Barbados Unemployment Among Seniors over 65 years
COMPARE
Black/African American
Immigrants from Barbados
Unemployment Among Seniors over 65 years
Unemployment Among Seniors over 65 years Comparison
Blacks/African Americans
Immigrants from Barbados
5.5%
UNEMPLOYMENT AMONG SENIORS OVER 65 YEARS
0.0/ 100
METRIC RATING
291st/ 347
METRIC RANK
5.5%
UNEMPLOYMENT AMONG SENIORS OVER 65 YEARS
0.0/ 100
METRIC RATING
286th/ 347
METRIC RANK
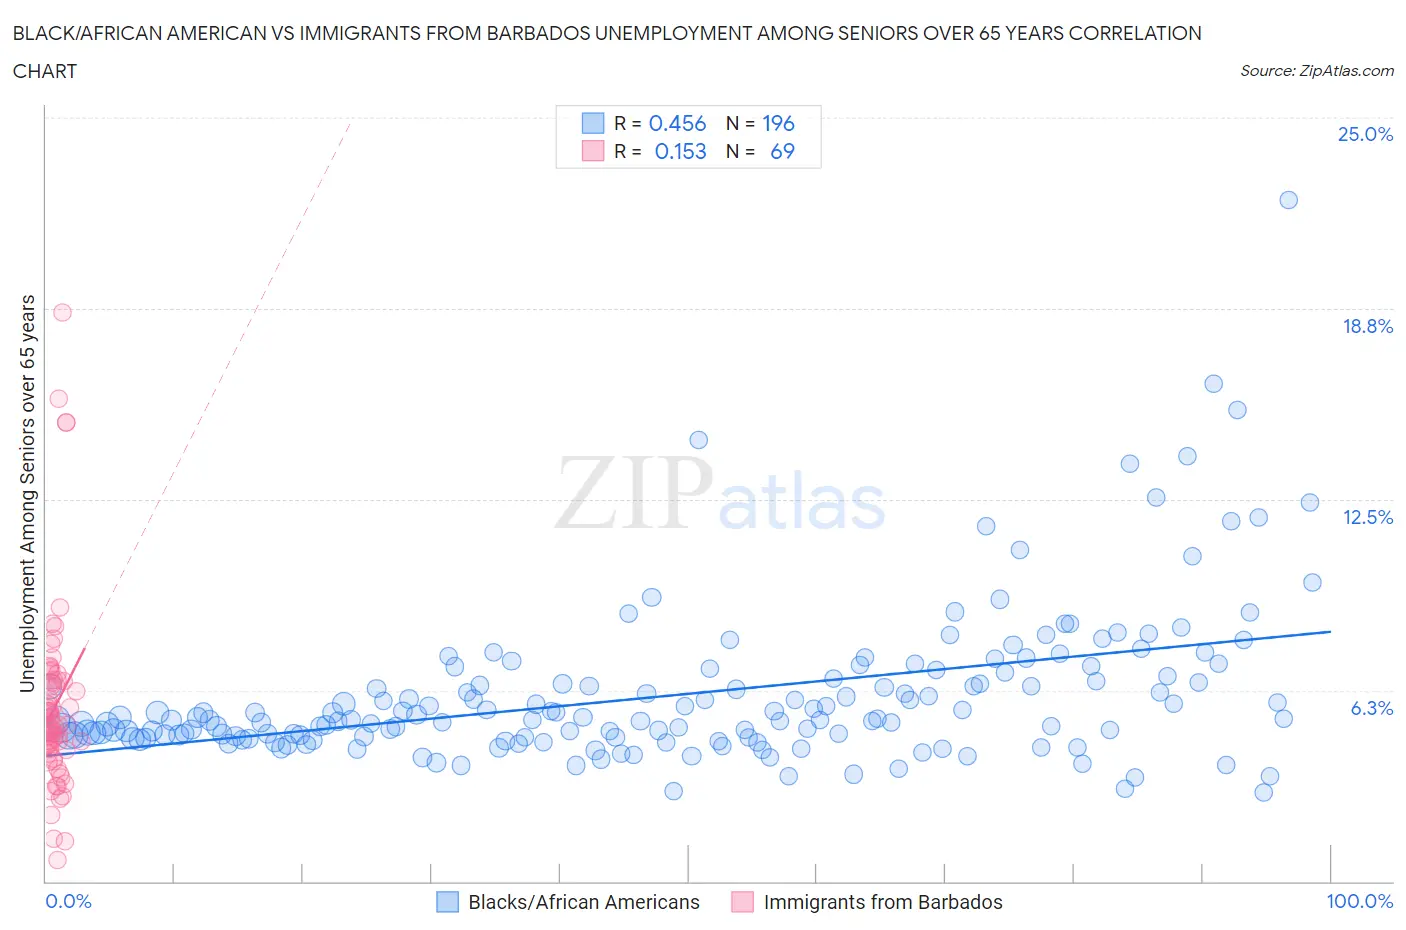
Black/African American vs Immigrants from Barbados Unemployment Among Seniors over 65 years Correlation Chart
The statistical analysis conducted on geographies consisting of 461,286,311 people shows a moderate positive correlation between the proportion of Blacks/African Americans and unemployment rate amomg seniors over the age of 65 in the United States with a correlation coefficient (R) of 0.456 and weighted average of 5.5%. Similarly, the statistical analysis conducted on geographies consisting of 109,022,444 people shows a poor positive correlation between the proportion of Immigrants from Barbados and unemployment rate amomg seniors over the age of 65 in the United States with a correlation coefficient (R) of 0.153 and weighted average of 5.5%, a difference of 0.51%.
Unemployment Among Seniors over 65 years Correlation Summary
| Measurement | Black/African American | Immigrants from Barbados |
| Minimum | 2.9% | 0.70% |
| Maximum | 22.3% | 18.6% |
| Range | 19.4% | 17.9% |
| Mean | 6.1% | 5.7% |
| Median | 5.3% | 5.1% |
| Interquartile 25% (IQ1) | 4.7% | 4.2% |
| Interquartile 75% (IQ3) | 6.6% | 6.6% |
| Interquartile Range (IQR) | 1.9% | 2.3% |
| Standard Deviation (Sample) | 2.5% | 3.1% |
| Standard Deviation (Population) | 2.5% | 3.1% |
Demographics Similar to Blacks/African Americans and Immigrants from Barbados by Unemployment Among Seniors over 65 years
In terms of unemployment among seniors over 65 years, the demographic groups most similar to Blacks/African Americans are Jamaican (5.5%, a difference of 0.030%), Belizean (5.5%, a difference of 0.15%), Immigrants from Venezuela (5.5%, a difference of 0.19%), Armenian (5.5%, a difference of 0.23%), and Cheyenne (5.5%, a difference of 0.30%). Similarly, the demographic groups most similar to Immigrants from Barbados are Central American (5.5%, a difference of 0.030%), Venezuelan (5.5%, a difference of 0.030%), U.S. Virgin Islander (5.5%, a difference of 0.030%), Immigrants from Cabo Verde (5.5%, a difference of 0.060%), and Immigrants from Liberia (5.5%, a difference of 0.080%).
| Demographics | Rating | Rank | Unemployment Among Seniors over 65 years |
| Colville | 0.1 /100 | #278 | Tragic 5.4% |
| Brazilians | 0.1 /100 | #279 | Tragic 5.5% |
| Immigrants | South America | 0.1 /100 | #280 | Tragic 5.5% |
| Immigrants | Norway | 0.0 /100 | #281 | Tragic 5.5% |
| Immigrants | Belize | 0.0 /100 | #282 | Tragic 5.5% |
| Immigrants | Haiti | 0.0 /100 | #283 | Tragic 5.5% |
| Immigrants | Liberia | 0.0 /100 | #284 | Tragic 5.5% |
| Central Americans | 0.0 /100 | #285 | Tragic 5.5% |
| Immigrants | Barbados | 0.0 /100 | #286 | Tragic 5.5% |
| Venezuelans | 0.0 /100 | #287 | Tragic 5.5% |
| U.S. Virgin Islanders | 0.0 /100 | #288 | Tragic 5.5% |
| Immigrants | Cabo Verde | 0.0 /100 | #289 | Tragic 5.5% |
| Jamaicans | 0.0 /100 | #290 | Tragic 5.5% |
| Blacks/African Americans | 0.0 /100 | #291 | Tragic 5.5% |
| Belizeans | 0.0 /100 | #292 | Tragic 5.5% |
| Immigrants | Venezuela | 0.0 /100 | #293 | Tragic 5.5% |
| Armenians | 0.0 /100 | #294 | Tragic 5.5% |
| Cheyenne | 0.0 /100 | #295 | Tragic 5.5% |
| Cape Verdeans | 0.0 /100 | #296 | Tragic 5.5% |
| Yaqui | 0.0 /100 | #297 | Tragic 5.5% |
| Immigrants | West Indies | 0.0 /100 | #298 | Tragic 5.6% |