Black/African American vs Scandinavian Unemployment Among Seniors over 65 years
COMPARE
Black/African American
Scandinavian
Unemployment Among Seniors over 65 years
Unemployment Among Seniors over 65 years Comparison
Blacks/African Americans
Scandinavians
5.5%
UNEMPLOYMENT AMONG SENIORS OVER 65 YEARS
0.0/ 100
METRIC RATING
291st/ 347
METRIC RANK
4.9%
UNEMPLOYMENT AMONG SENIORS OVER 65 YEARS
99.8/ 100
METRIC RATING
58th/ 347
METRIC RANK
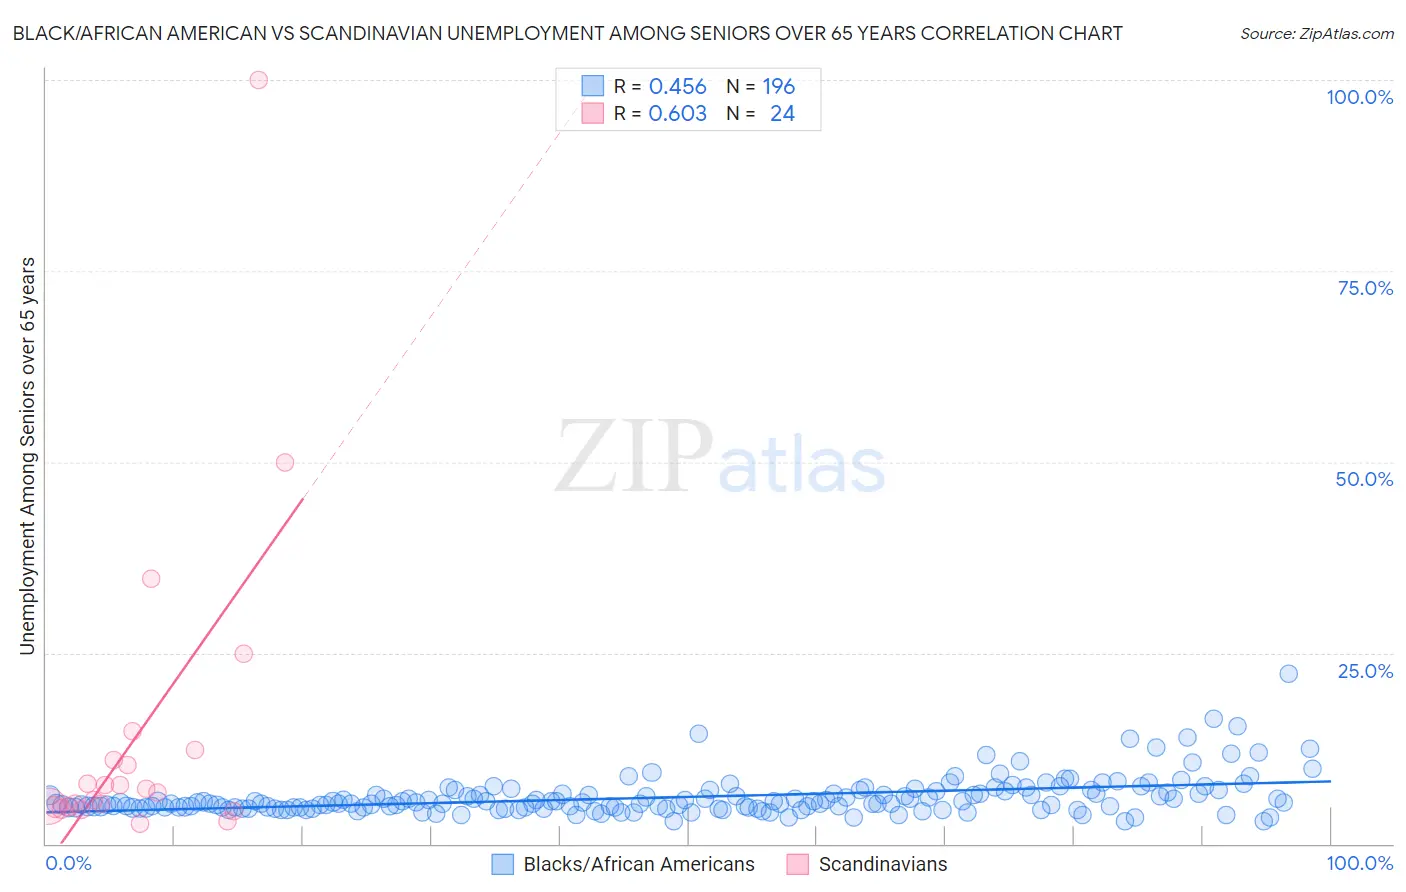
Black/African American vs Scandinavian Unemployment Among Seniors over 65 years Correlation Chart
The statistical analysis conducted on geographies consisting of 461,286,311 people shows a moderate positive correlation between the proportion of Blacks/African Americans and unemployment rate amomg seniors over the age of 65 in the United States with a correlation coefficient (R) of 0.456 and weighted average of 5.5%. Similarly, the statistical analysis conducted on geographies consisting of 401,897,876 people shows a significant positive correlation between the proportion of Scandinavians and unemployment rate amomg seniors over the age of 65 in the United States with a correlation coefficient (R) of 0.603 and weighted average of 4.9%, a difference of 13.1%.
Unemployment Among Seniors over 65 years Correlation Summary
| Measurement | Black/African American | Scandinavian |
| Minimum | 2.9% | 2.6% |
| Maximum | 22.3% | 100.0% |
| Range | 19.4% | 97.4% |
| Mean | 6.1% | 14.3% |
| Median | 5.3% | 6.9% |
| Interquartile 25% (IQ1) | 4.7% | 4.8% |
| Interquartile 75% (IQ3) | 6.6% | 11.6% |
| Interquartile Range (IQR) | 1.9% | 6.8% |
| Standard Deviation (Sample) | 2.5% | 21.3% |
| Standard Deviation (Population) | 2.5% | 20.9% |
Similar Demographics by Unemployment Among Seniors over 65 years
Demographics Similar to Blacks/African Americans by Unemployment Among Seniors over 65 years
In terms of unemployment among seniors over 65 years, the demographic groups most similar to Blacks/African Americans are Jamaican (5.5%, a difference of 0.030%), Belizean (5.5%, a difference of 0.15%), Immigrants from Venezuela (5.5%, a difference of 0.19%), Armenian (5.5%, a difference of 0.23%), and Cheyenne (5.5%, a difference of 0.30%).
| Demographics | Rating | Rank | Unemployment Among Seniors over 65 years |
| Immigrants | Liberia | 0.0 /100 | #284 | Tragic 5.5% |
| Central Americans | 0.0 /100 | #285 | Tragic 5.5% |
| Immigrants | Barbados | 0.0 /100 | #286 | Tragic 5.5% |
| Venezuelans | 0.0 /100 | #287 | Tragic 5.5% |
| U.S. Virgin Islanders | 0.0 /100 | #288 | Tragic 5.5% |
| Immigrants | Cabo Verde | 0.0 /100 | #289 | Tragic 5.5% |
| Jamaicans | 0.0 /100 | #290 | Tragic 5.5% |
| Blacks/African Americans | 0.0 /100 | #291 | Tragic 5.5% |
| Belizeans | 0.0 /100 | #292 | Tragic 5.5% |
| Immigrants | Venezuela | 0.0 /100 | #293 | Tragic 5.5% |
| Armenians | 0.0 /100 | #294 | Tragic 5.5% |
| Cheyenne | 0.0 /100 | #295 | Tragic 5.5% |
| Cape Verdeans | 0.0 /100 | #296 | Tragic 5.5% |
| Yaqui | 0.0 /100 | #297 | Tragic 5.5% |
| Immigrants | West Indies | 0.0 /100 | #298 | Tragic 5.6% |
Demographics Similar to Scandinavians by Unemployment Among Seniors over 65 years
In terms of unemployment among seniors over 65 years, the demographic groups most similar to Scandinavians are Danish (4.9%, a difference of 0.010%), Carpatho Rusyn (4.9%, a difference of 0.060%), European (4.9%, a difference of 0.11%), Immigrants from Iraq (4.9%, a difference of 0.12%), and Immigrants from Sudan (4.9%, a difference of 0.18%).
| Demographics | Rating | Rank | Unemployment Among Seniors over 65 years |
| Scotch-Irish | 99.9 /100 | #51 | Exceptional 4.9% |
| Swedes | 99.9 /100 | #52 | Exceptional 4.9% |
| Immigrants | Sudan | 99.8 /100 | #53 | Exceptional 4.9% |
| Immigrants | Iraq | 99.8 /100 | #54 | Exceptional 4.9% |
| Europeans | 99.8 /100 | #55 | Exceptional 4.9% |
| Carpatho Rusyns | 99.8 /100 | #56 | Exceptional 4.9% |
| Danes | 99.8 /100 | #57 | Exceptional 4.9% |
| Scandinavians | 99.8 /100 | #58 | Exceptional 4.9% |
| Immigrants | Eastern Africa | 99.7 /100 | #59 | Exceptional 4.9% |
| Immigrants | Middle Africa | 99.7 /100 | #60 | Exceptional 4.9% |
| Northern Europeans | 99.7 /100 | #61 | Exceptional 4.9% |
| Latvians | 99.6 /100 | #62 | Exceptional 4.9% |
| Croatians | 99.6 /100 | #63 | Exceptional 4.9% |
| Immigrants | Cambodia | 99.6 /100 | #64 | Exceptional 4.9% |
| Immigrants | Nicaragua | 99.6 /100 | #65 | Exceptional 4.9% |