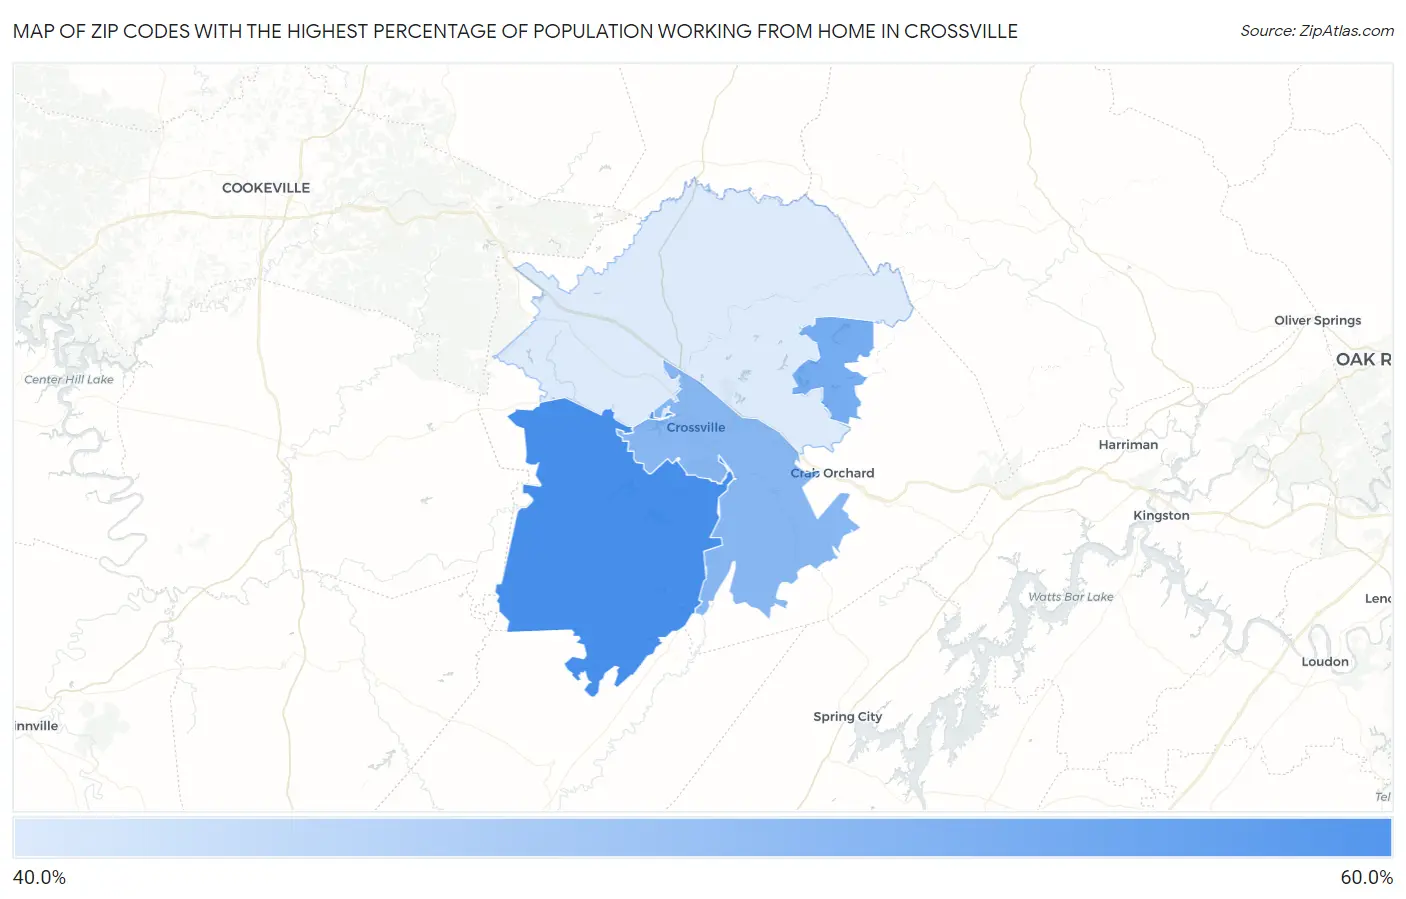
Zip Codes with the Highest Percentage of Population Working from Home in Crossville, TN
RELATED REPORTS & OPTIONS
Work from Home
Crossville
Compare Zip Codes
Map of Zip Codes with the Highest Percentage of Population Working from Home in Crossville
0.0%
60.0%
Zip Codes with the Highest Percentage of Population Working from Home in Crossville, TN
| Zip Code | % Work from Home | vs State | vs National | |
| 1. | 38572 | 59.1% | 43.7%(+15.4)#32 | 44.0%(+15.1)#2,342 |
| 2. | 38558 | 55.0% | 43.7%(+11.3)#62 | 44.0%(+11.0)#4,458 |
| 3. | 38555 | 53.4% | 43.7%(+9.70)#81 | 44.0%(+9.40)#5,558 |
| 4. | 38571 | 46.0% | 43.7%(+2.30)#245 | 44.0%(+2.00)#13,167 |
1
Common Questions
What are the Top 3 Zip Codes with the Highest Percentage of Population Working from Home in Crossville, TN?
Top 3 Zip Codes with the Highest Percentage of Population Working from Home in Crossville, TN are:
What zip code has the Highest Percentage of Population Working from Home in Crossville, TN?
38572 has the Highest Percentage of Population Working from Home in Crossville, TN with 59.1%.
What is the Percentage of Population Working from Home in Crossville, TN?
Percentage of Population Working from Home in Crossville is 41.4%.
What is the Percentage of Population Working from Home in Tennessee?
Percentage of Population Working from Home in Tennessee is 43.7%.
What is the Percentage of Population Working from Home in the United States?
Percentage of Population Working from Home in the United States is 44.0%.