Zip Codes with the Highest Percentage of Population Employed in Health Diagnosing & Treating in North Augusta, SC
RELATED REPORTS & OPTIONS
Health Diagnosing & Treating
North Augusta
Compare Zip Codes
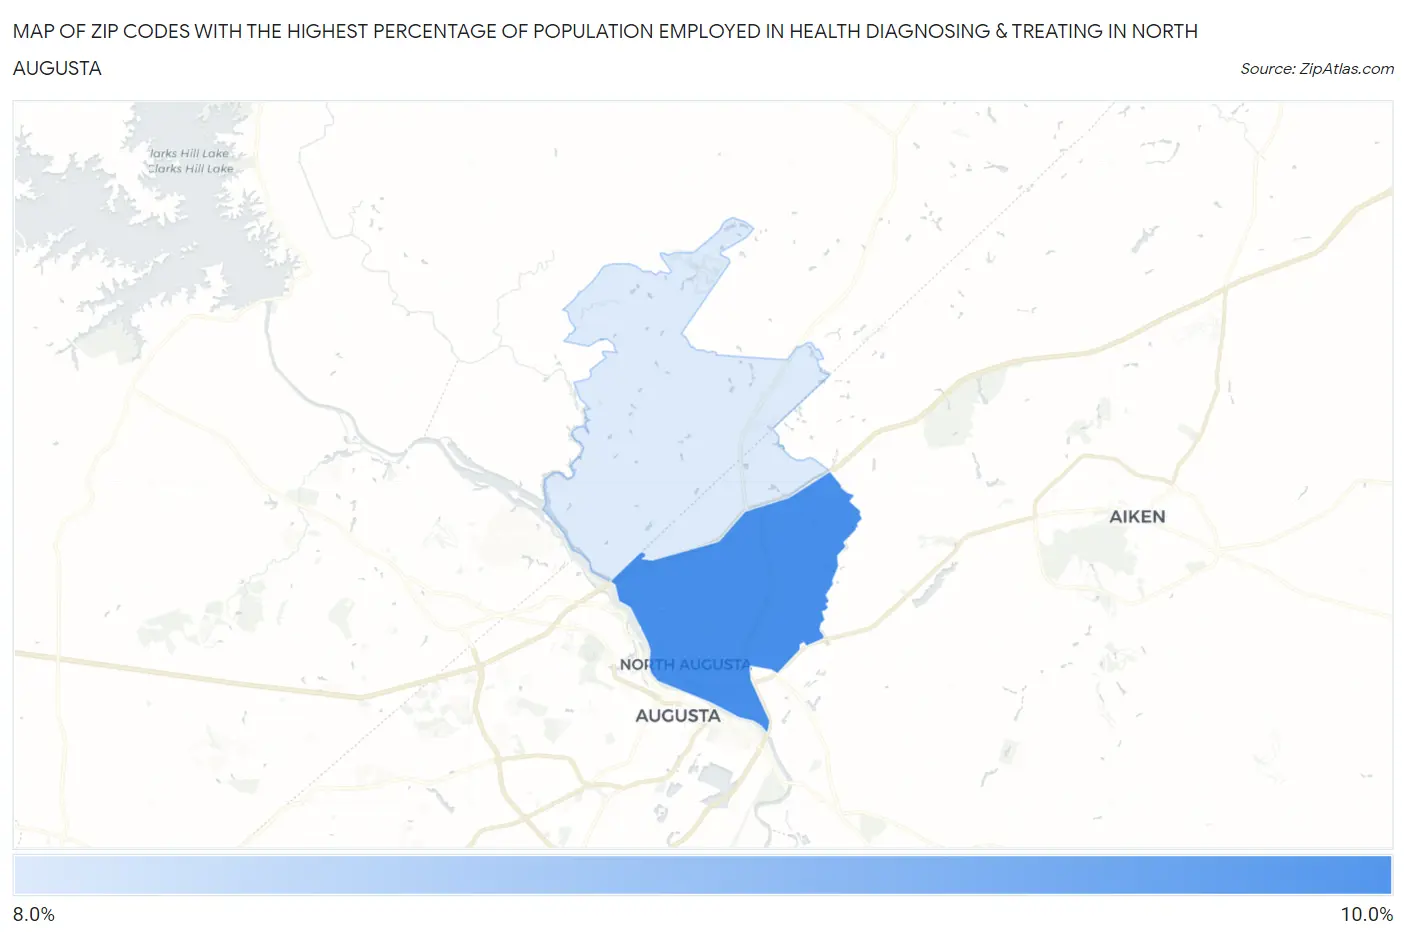
Map of Zip Codes with the Highest Percentage of Population Employed in Health Diagnosing & Treating in North Augusta
8.4%
9.0%
Zip Codes with the Highest Percentage of Population Employed in Health Diagnosing & Treating in North Augusta, SC
| Zip Code | % Employed | vs State | vs National | |
| 1. | 29841 | 9.0% | 6.7%(+2.24)#69 | 6.2%(+2.71)#5,434 |
| 2. | 29860 | 8.4% | 6.7%(+1.64)#87 | 6.2%(+2.12)#6,613 |
1
Common Questions
What are the Top Zip Codes with the Highest Percentage of Population Employed in Health Diagnosing & Treating in North Augusta, SC?
Top Zip Codes with the Highest Percentage of Population Employed in Health Diagnosing & Treating in North Augusta, SC are:
What zip code has the Highest Percentage of Population Employed in Health Diagnosing & Treating in North Augusta, SC?
29841 has the Highest Percentage of Population Employed in Health Diagnosing & Treating in North Augusta, SC with 9.0%.
What is the Percentage of Population Employed in Health Diagnosing & Treating in North Augusta, SC?
Percentage of Population Employed in Health Diagnosing & Treating in North Augusta is 11.4%.
What is the Percentage of Population Employed in Health Diagnosing & Treating in South Carolina?
Percentage of Population Employed in Health Diagnosing & Treating in South Carolina is 6.7%.
What is the Percentage of Population Employed in Health Diagnosing & Treating in the United States?
Percentage of Population Employed in Health Diagnosing & Treating in the United States is 6.2%.