Zip Codes with the Highest Percentage of Population Employed in Health Diagnosing & Treating in Simpsonville, SC
RELATED REPORTS & OPTIONS
Health Diagnosing & Treating
Simpsonville
Compare Zip Codes
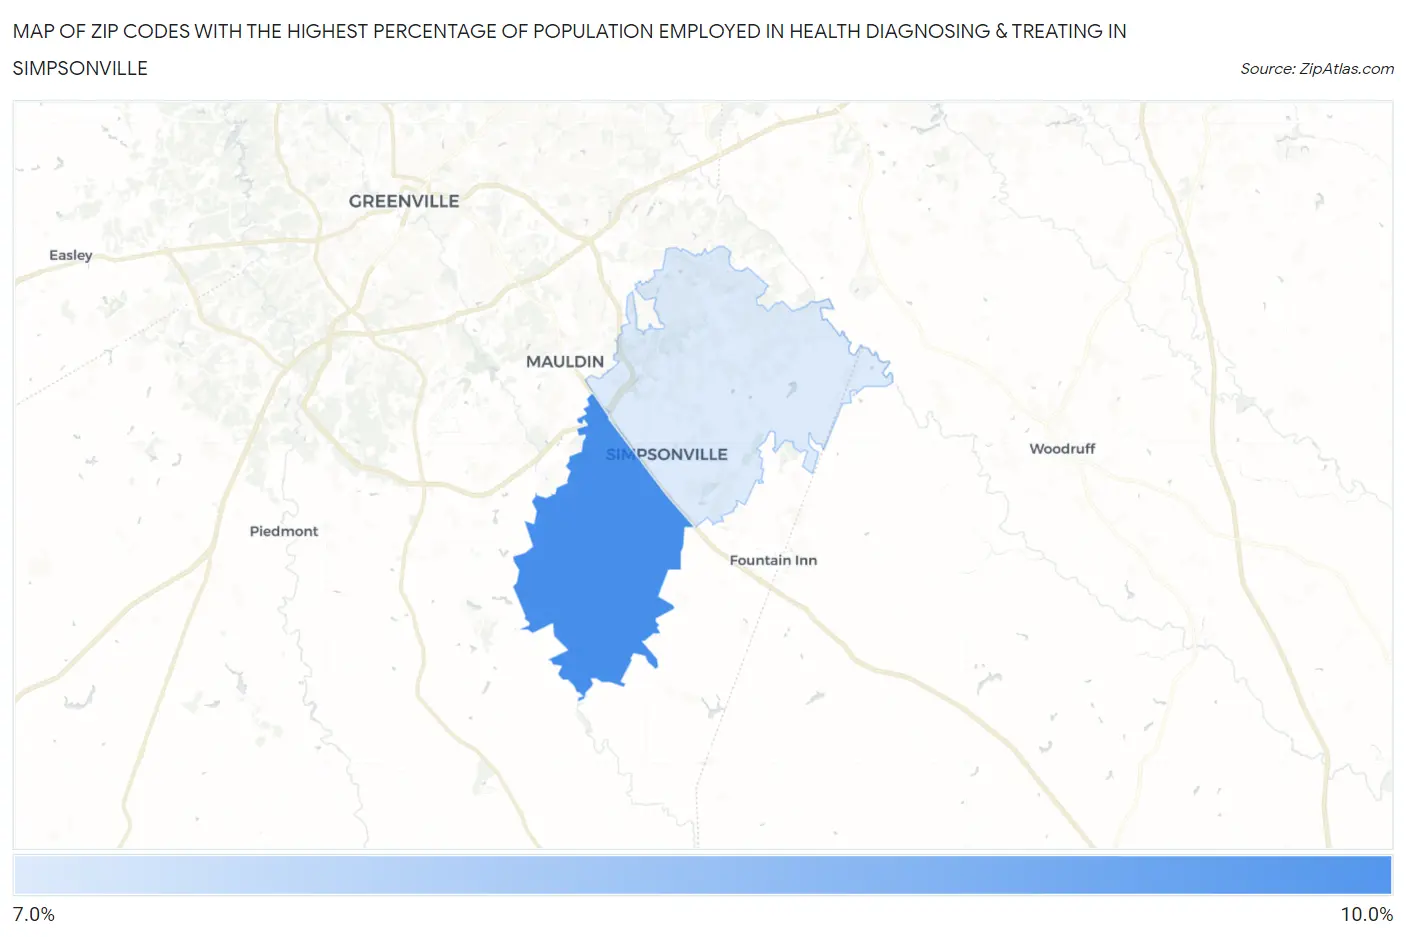
Map of Zip Codes with the Highest Percentage of Population Employed in Health Diagnosing & Treating in Simpsonville
7.9%
8.0%
Zip Codes with the Highest Percentage of Population Employed in Health Diagnosing & Treating in Simpsonville, SC
| Zip Code | % Employed | vs State | vs National | |
| 1. | 29680 | 8.0% | 6.7%(+1.30)#100 | 6.2%(+1.78)#7,448 |
| 2. | 29681 | 7.9% | 6.7%(+1.13)#110 | 6.2%(+1.61)#7,874 |
1
Common Questions
What are the Top Zip Codes with the Highest Percentage of Population Employed in Health Diagnosing & Treating in Simpsonville, SC?
Top Zip Codes with the Highest Percentage of Population Employed in Health Diagnosing & Treating in Simpsonville, SC are:
What zip code has the Highest Percentage of Population Employed in Health Diagnosing & Treating in Simpsonville, SC?
29680 has the Highest Percentage of Population Employed in Health Diagnosing & Treating in Simpsonville, SC with 8.0%.
What is the Percentage of Population Employed in Health Diagnosing & Treating in Simpsonville, SC?
Percentage of Population Employed in Health Diagnosing & Treating in Simpsonville is 5.6%.
What is the Percentage of Population Employed in Health Diagnosing & Treating in South Carolina?
Percentage of Population Employed in Health Diagnosing & Treating in South Carolina is 6.7%.
What is the Percentage of Population Employed in Health Diagnosing & Treating in the United States?
Percentage of Population Employed in Health Diagnosing & Treating in the United States is 6.2%.