Zip Codes with the Highest Percentage of Population Employed in Computer & Mathematics in Darlington, SC
RELATED REPORTS & OPTIONS
Computer & Mathematics
Darlington
Compare Zip Codes
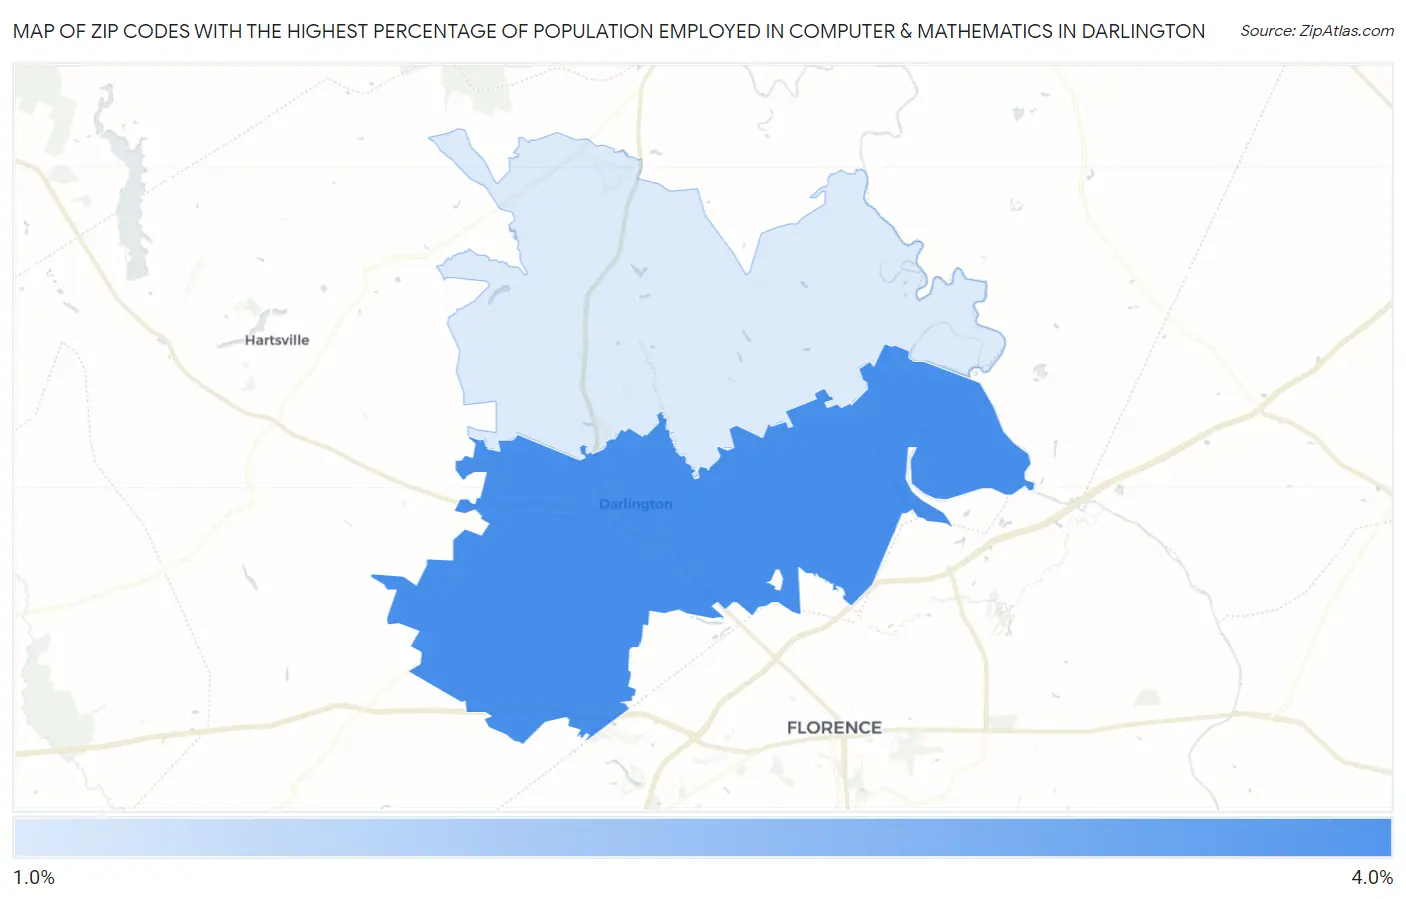
Map of Zip Codes with the Highest Percentage of Population Employed in Computer & Mathematics in Darlington
1.3%
3.6%
Zip Codes with the Highest Percentage of Population Employed in Computer & Mathematics in Darlington, SC
| Zip Code | % Employed | vs State | vs National | |
| 1. | 29532 | 3.6% | 2.4%(+1.19)#47 | 3.5%(+0.082)#5,946 |
| 2. | 29540 | 1.3% | 2.4%(-1.11)#191 | 3.5%(-2.22)#15,482 |
1
Common Questions
What are the Top Zip Codes with the Highest Percentage of Population Employed in Computer & Mathematics in Darlington, SC?
Top Zip Codes with the Highest Percentage of Population Employed in Computer & Mathematics in Darlington, SC are:
What zip code has the Highest Percentage of Population Employed in Computer & Mathematics in Darlington, SC?
29532 has the Highest Percentage of Population Employed in Computer & Mathematics in Darlington, SC with 3.6%.
What is the Percentage of Population Employed in Computer & Mathematics in Darlington, SC?
Percentage of Population Employed in Computer & Mathematics in Darlington is 2.0%.
What is the Percentage of Population Employed in Computer & Mathematics in South Carolina?
Percentage of Population Employed in Computer & Mathematics in South Carolina is 2.4%.
What is the Percentage of Population Employed in Computer & Mathematics in the United States?
Percentage of Population Employed in Computer & Mathematics in the United States is 3.5%.