Zip Codes with the Highest Percentage of Private Company Employees in Darlington, SC
RELATED REPORTS & OPTIONS
Private Company Employees
Darlington
Compare Zip Codes
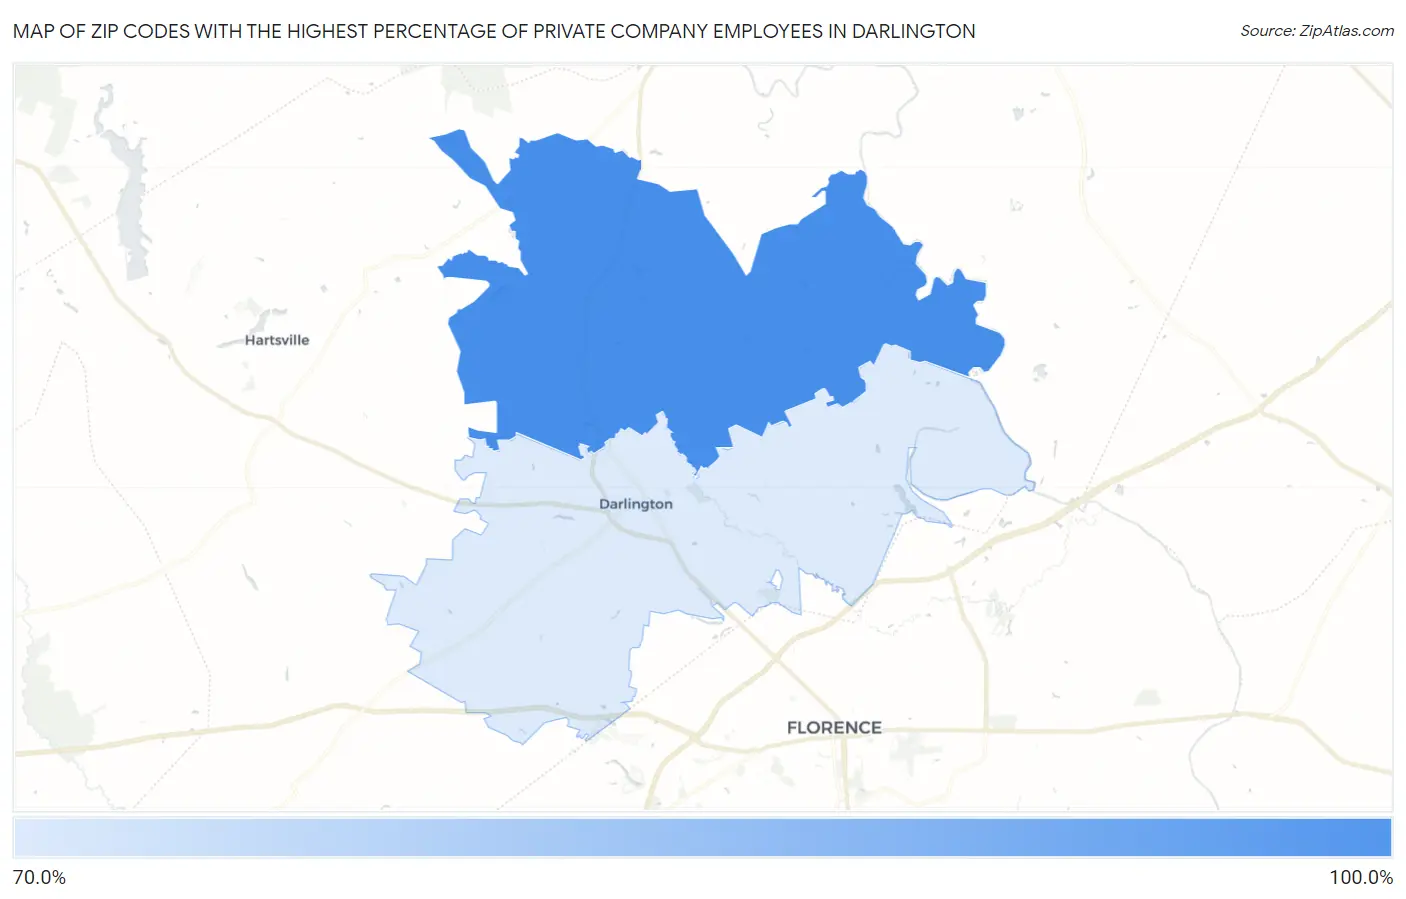
Map of Zip Codes with the Highest Percentage of Private Company Employees in Darlington
72.6%
81.5%
Zip Codes with the Highest Percentage of Private Company Employees in Darlington, SC
| Zip Code | % Private Company Employees | vs State | vs National | |
| 1. | 29540 | 81.5% | 67.4%(+14.1)#35 | 66.9%(+14.6)#1,907 |
| 2. | 29532 | 72.6% | 67.4%(+5.17)#128 | 66.9%(+5.70)#7,176 |
1
Common Questions
What are the Top Zip Codes with the Highest Percentage of Private Company Employees in Darlington, SC?
Top Zip Codes with the Highest Percentage of Private Company Employees in Darlington, SC are:
What zip code has the Highest Percentage of Private Company Employees in Darlington, SC?
29540 has the Highest Percentage of Private Company Employees in Darlington, SC with 81.5%.
What is the Percentage of Private Company Employees in Darlington, SC?
Percentage of Private Company Employees in Darlington is 60.2%.
What is the Percentage of Private Company Employees in South Carolina?
Percentage of Private Company Employees in South Carolina is 67.4%.
What is the Percentage of Private Company Employees in the United States?
Percentage of Private Company Employees in the United States is 66.9%.