Zip Codes with the Most Immigrants from Latin America in Darlington, SC
RELATED REPORTS & OPTIONS
Latin America
Darlington
Compare Zip Codes
Map of Zip Codes with the Most Immigrants from Latin America in Darlington
61
76
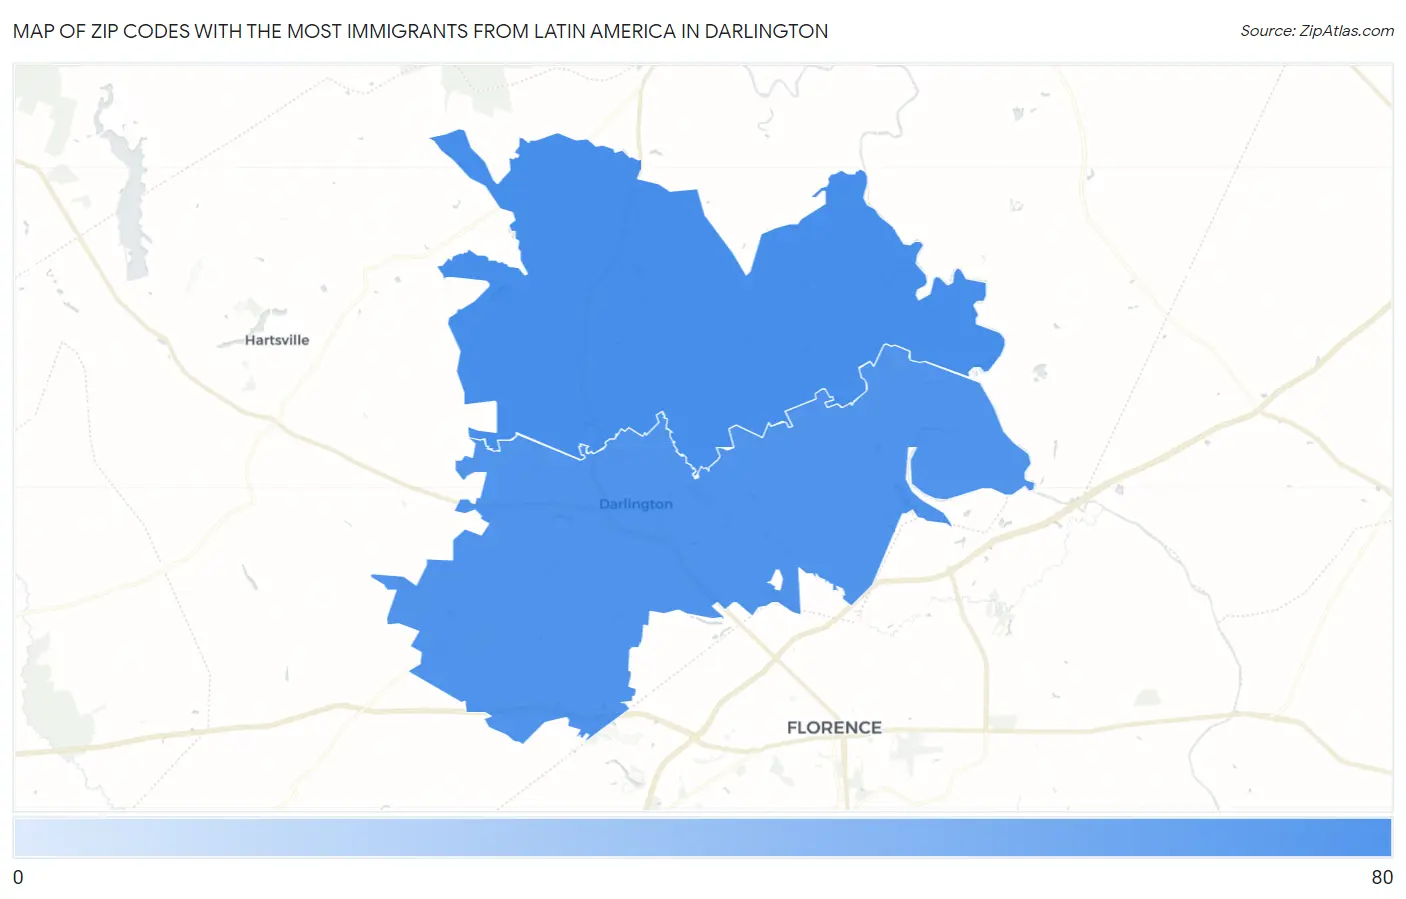
Zip Codes with the Most Immigrants from Latin America in Darlington, SC
| Zip Code | Latin America | vs State | vs National | |
| 1. | 29540 | 76 | 135,121(0.06%)#198 | 22,649,518(0.00%)#12,024 |
| 2. | 29532 | 61 | 135,121(0.05%)#214 | 22,649,518(0.00%)#12,657 |
1
Common Questions
What are the Top Zip Codes with the Most Immigrants from Latin America in Darlington, SC?
Top Zip Codes with the Most Immigrants from Latin America in Darlington, SC are:
What zip code has the Most Immigrants from Latin America in Darlington, SC?
29540 has the Most Immigrants from Latin America in Darlington, SC with 76.
What is the Total Immigrants from Latin America in Darlington, SC?
Total Immigrants from Latin America in Darlington is 16.
What is the Total Immigrants from Latin America in South Carolina?
Total Immigrants from Latin America in South Carolina is 135,121.
What is the Total Immigrants from Latin America in the United States?
Total Immigrants from Latin America in the United States is 22,649,518.