Zip Codes with the Highest Percentage of Population Employed in Office & Administration in Darlington, SC
RELATED REPORTS & OPTIONS
Office & Administration
Darlington
Compare Zip Codes
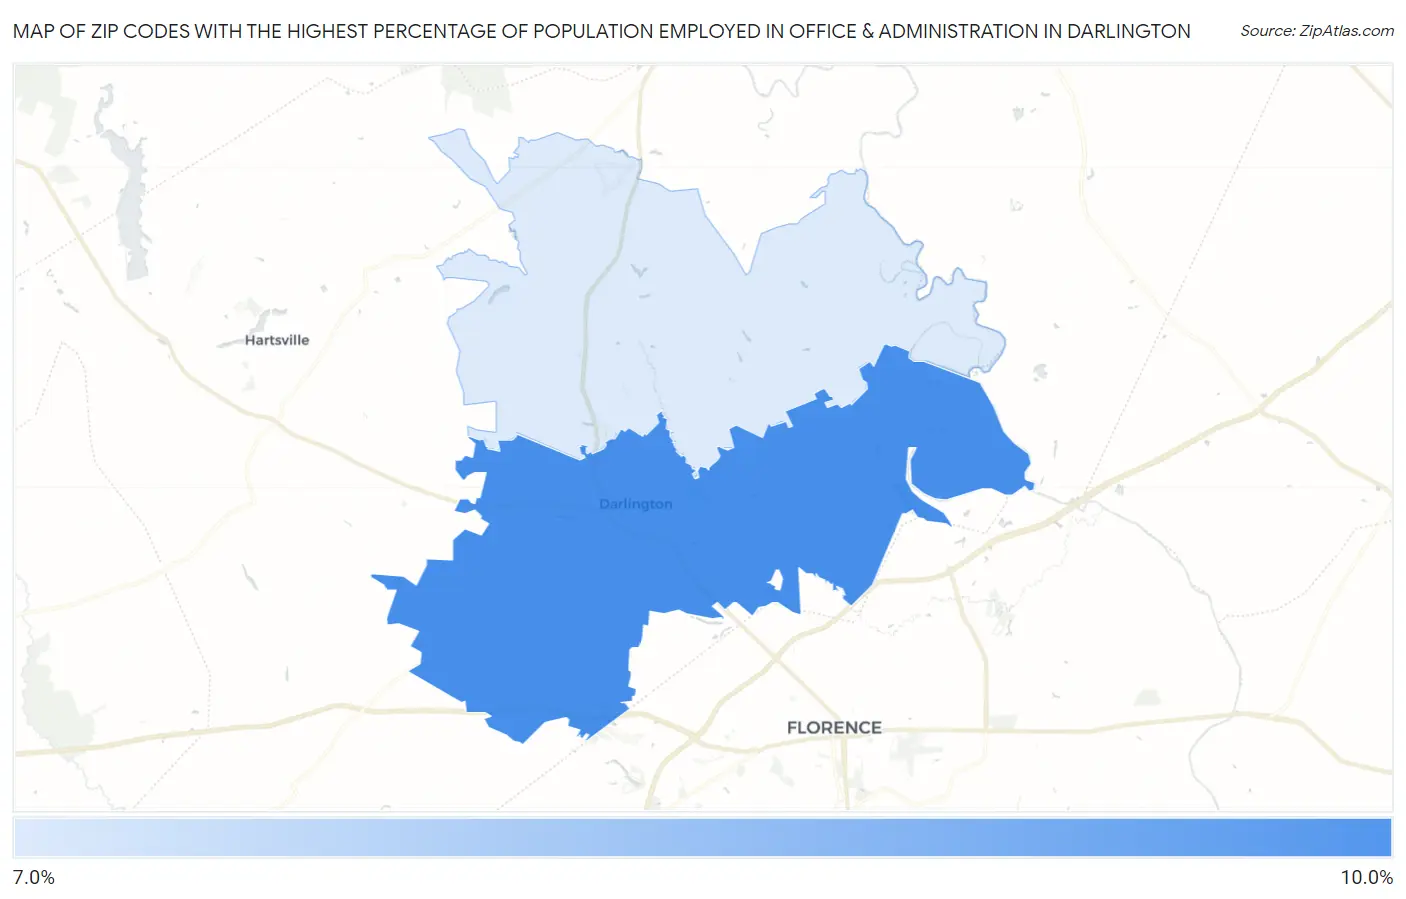
Map of Zip Codes with the Highest Percentage of Population Employed in Office & Administration in Darlington
7.4%
9.3%
Zip Codes with the Highest Percentage of Population Employed in Office & Administration in Darlington, SC
| Zip Code | % Employed | vs State | vs National | |
| 1. | 29532 | 9.3% | 10.7%(-1.37)#233 | 10.9%(-1.57)#19,416 |
| 2. | 29540 | 7.4% | 10.7%(-3.30)#316 | 10.9%(-3.50)#24,505 |
1
Common Questions
What are the Top Zip Codes with the Highest Percentage of Population Employed in Office & Administration in Darlington, SC?
Top Zip Codes with the Highest Percentage of Population Employed in Office & Administration in Darlington, SC are:
What zip code has the Highest Percentage of Population Employed in Office & Administration in Darlington, SC?
29532 has the Highest Percentage of Population Employed in Office & Administration in Darlington, SC with 9.3%.
What is the Percentage of Population Employed in Office & Administration in Darlington, SC?
Percentage of Population Employed in Office & Administration in Darlington is 10.5%.
What is the Percentage of Population Employed in Office & Administration in South Carolina?
Percentage of Population Employed in Office & Administration in South Carolina is 10.7%.
What is the Percentage of Population Employed in Office & Administration in the United States?
Percentage of Population Employed in Office & Administration in the United States is 10.9%.