Zip Codes with the Highest Percentage of Population Employed in Computer & Mathematics in Greenwood, SC
RELATED REPORTS & OPTIONS
Computer & Mathematics
Greenwood
Compare Zip Codes
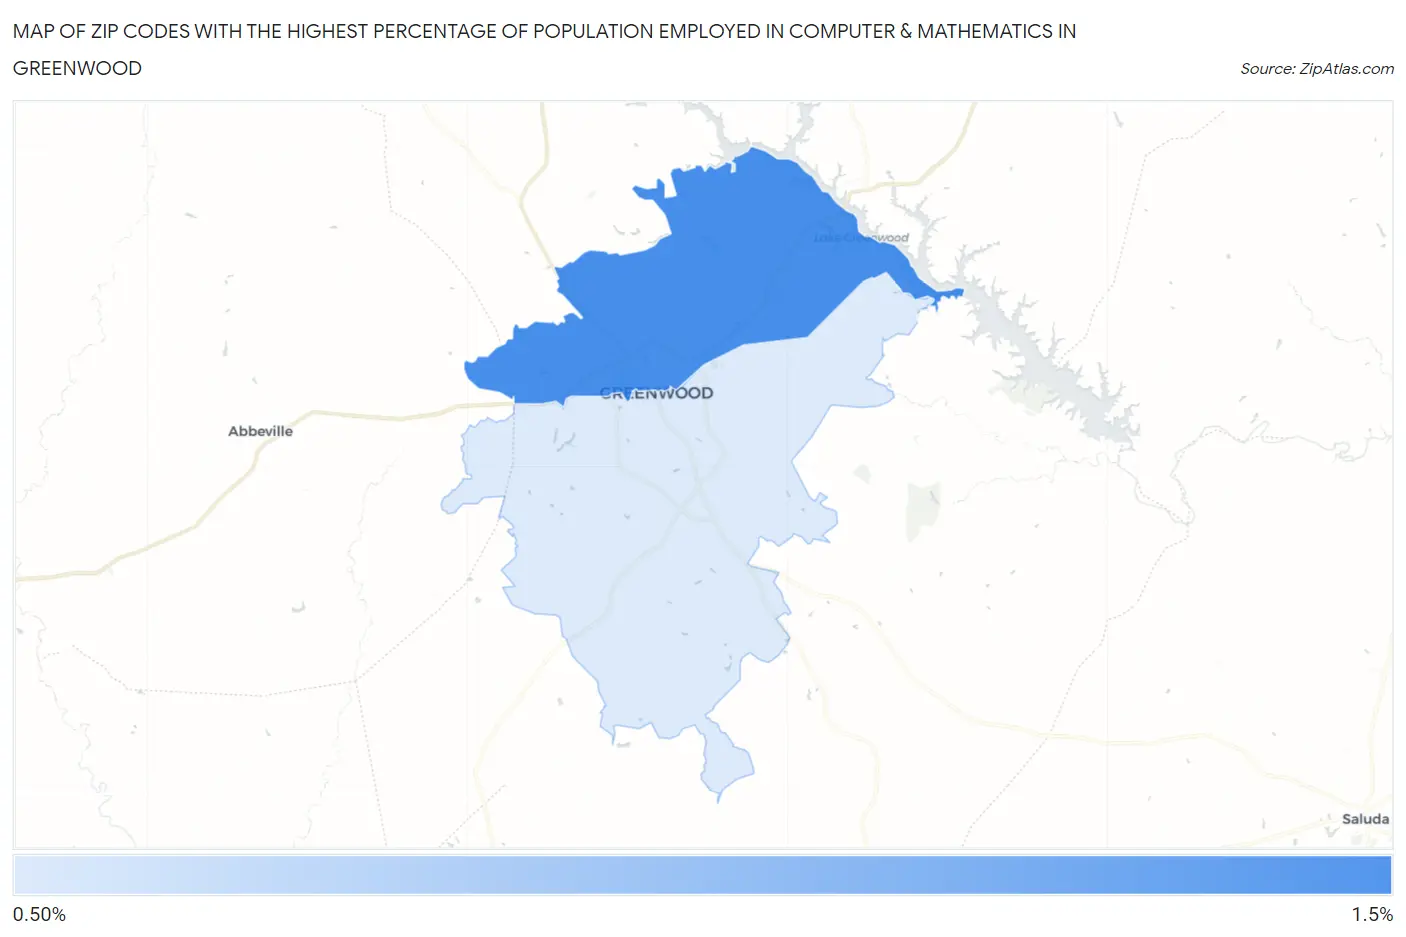
Map of Zip Codes with the Highest Percentage of Population Employed in Computer & Mathematics in Greenwood
0.55%
1.1%
Zip Codes with the Highest Percentage of Population Employed in Computer & Mathematics in Greenwood, SC
| Zip Code | % Employed | vs State | vs National | |
| 1. | 29649 | 1.1% | 2.4%(-1.37)#217 | 3.5%(-2.47)#17,068 |
| 2. | 29646 | 0.55% | 2.4%(-1.87)#272 | 3.5%(-2.97)#20,168 |
1
Common Questions
What are the Top Zip Codes with the Highest Percentage of Population Employed in Computer & Mathematics in Greenwood, SC?
Top Zip Codes with the Highest Percentage of Population Employed in Computer & Mathematics in Greenwood, SC are:
What zip code has the Highest Percentage of Population Employed in Computer & Mathematics in Greenwood, SC?
29649 has the Highest Percentage of Population Employed in Computer & Mathematics in Greenwood, SC with 1.1%.
What is the Percentage of Population Employed in Computer & Mathematics in Greenwood, SC?
Percentage of Population Employed in Computer & Mathematics in Greenwood is 0.59%.
What is the Percentage of Population Employed in Computer & Mathematics in South Carolina?
Percentage of Population Employed in Computer & Mathematics in South Carolina is 2.4%.
What is the Percentage of Population Employed in Computer & Mathematics in the United States?
Percentage of Population Employed in Computer & Mathematics in the United States is 3.5%.