Zip Codes with the Highest Percentage of Population with a Degree in Liberal Arts and History in Charleston, SC
RELATED REPORTS & OPTIONS
Liberal Arts and History
Charleston
Compare Zip Codes
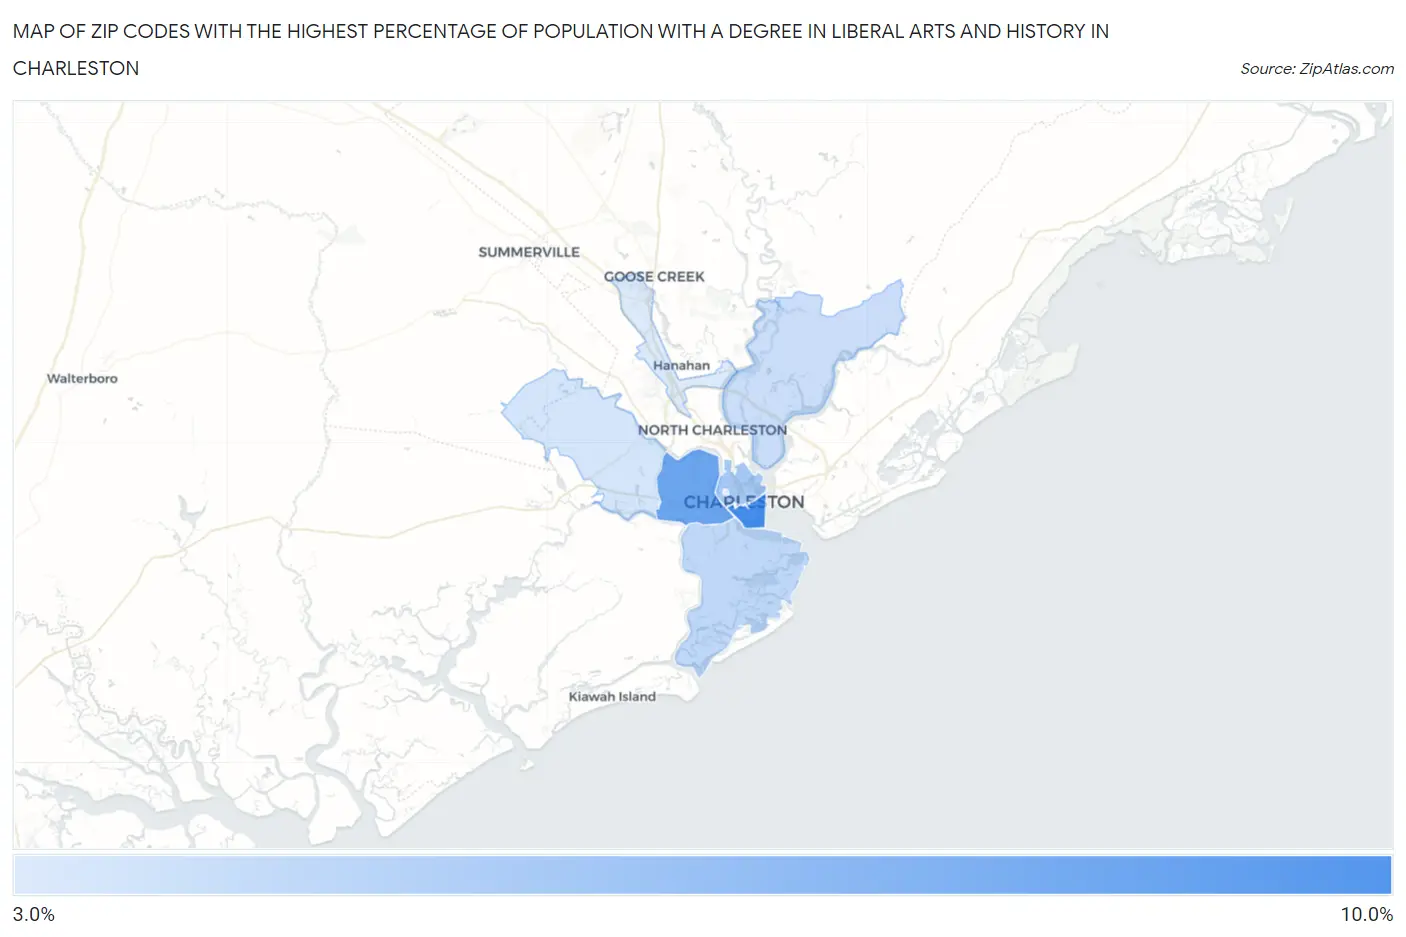
Map of Zip Codes with the Highest Percentage of Population with a Degree in Liberal Arts and History in Charleston
3.1%
9.0%
Zip Codes with the Highest Percentage of Population with a Degree in Liberal Arts and History in Charleston, SC
| Zip Code | % Graduates | vs State | vs National | |
| 1. | 29401 | 9.0% | 5.2%(+3.78)#60 | 4.9%(+4.11)#3,882 |
| 2. | 29407 | 7.5% | 5.2%(+2.30)#84 | 4.9%(+2.62)#5,599 |
| 3. | 29403 | 5.2% | 5.2%(+0.032)#167 | 4.9%(+0.359)#10,644 |
| 4. | 29412 | 4.2% | 5.2%(-0.976)#212 | 4.9%(-0.650)#13,921 |
| 5. | 29492 | 3.8% | 5.2%(-1.38)#229 | 4.9%(-1.06)#15,459 |
| 6. | 29414 | 3.4% | 5.2%(-1.75)#249 | 4.9%(-1.42)#16,785 |
| 7. | 29406 | 3.1% | 5.2%(-2.12)#263 | 4.9%(-1.80)#18,078 |
1
Common Questions
What are the Top 5 Zip Codes with the Highest Percentage of Population with a Degree in Liberal Arts and History in Charleston, SC?
Top 5 Zip Codes with the Highest Percentage of Population with a Degree in Liberal Arts and History in Charleston, SC are:
What zip code has the Highest Percentage of Population with a Degree in Liberal Arts and History in Charleston, SC?
29401 has the Highest Percentage of Population with a Degree in Liberal Arts and History in Charleston, SC with 9.0%.
What is the Percentage of Population with a Degree in Liberal Arts and History in Charleston, SC?
Percentage of Population with a Degree in Liberal Arts and History in Charleston is 4.5%.
What is the Percentage of Population with a Degree in Liberal Arts and History in South Carolina?
Percentage of Population with a Degree in Liberal Arts and History in South Carolina is 5.2%.
What is the Percentage of Population with a Degree in Liberal Arts and History in the United States?
Percentage of Population with a Degree in Liberal Arts and History in the United States is 4.9%.