Zip Codes with the Highest Percentage of Population with a Degree in Liberal Arts and History in West Columbia, SC
RELATED REPORTS & OPTIONS
Liberal Arts and History
West Columbia
Compare Zip Codes
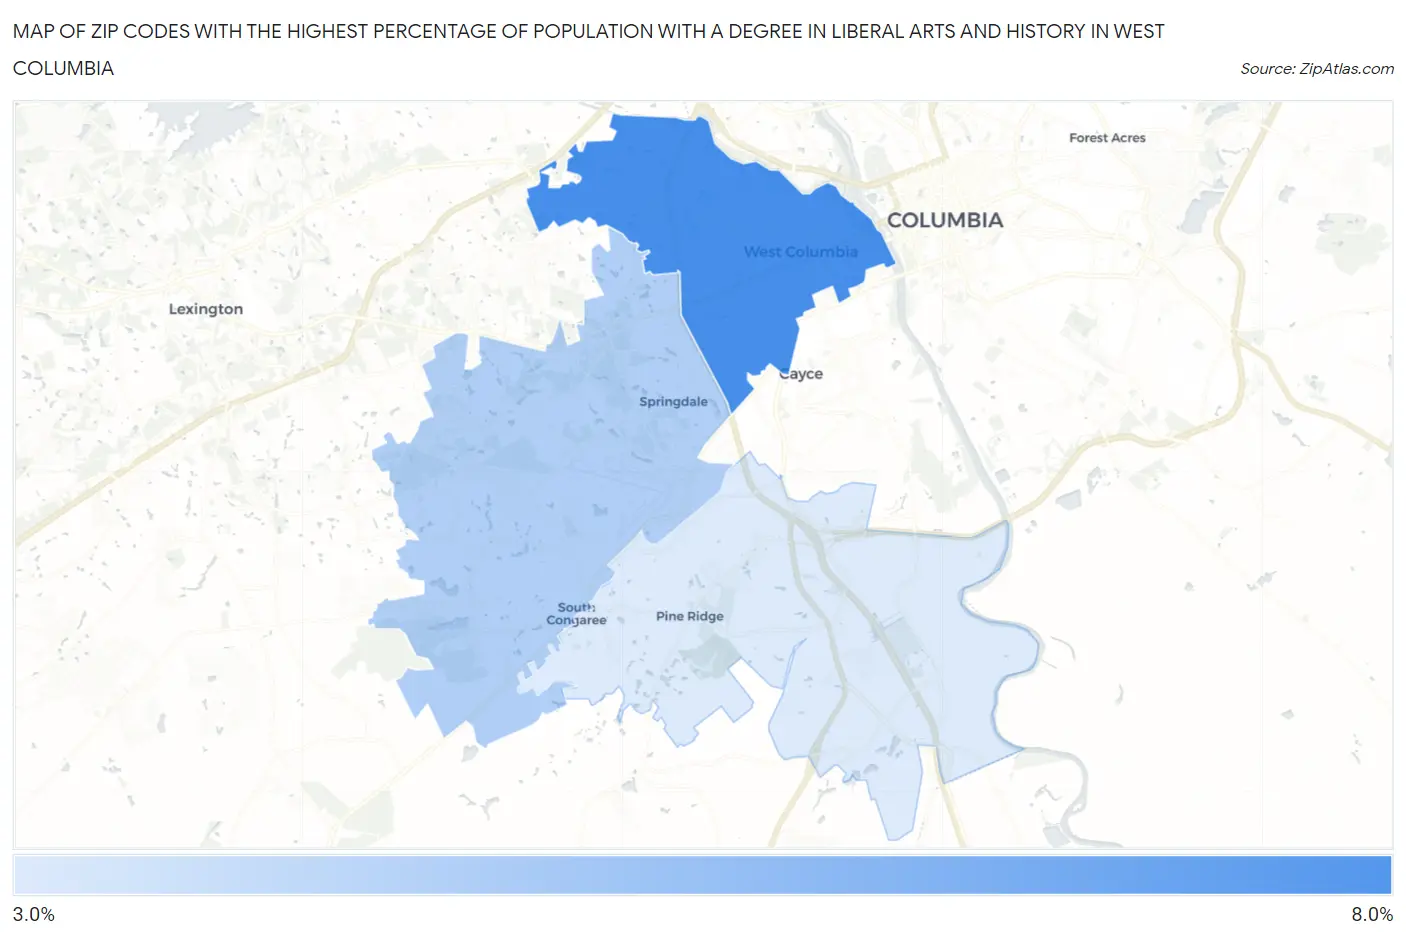
Map of Zip Codes with the Highest Percentage of Population with a Degree in Liberal Arts and History in West Columbia
3.7%
7.2%
Zip Codes with the Highest Percentage of Population with a Degree in Liberal Arts and History in West Columbia, SC
| Zip Code | % Graduates | vs State | vs National | |
| 1. | 29169 | 7.2% | 5.2%(+2.03)#97 | 4.9%(+2.36)#5,995 |
| 2. | 29170 | 4.7% | 5.2%(-0.457)#189 | 4.9%(-0.131)#12,187 |
| 3. | 29172 | 3.7% | 5.2%(-1.51)#237 | 4.9%(-1.18)#15,940 |
1
Common Questions
What are the Top Zip Codes with the Highest Percentage of Population with a Degree in Liberal Arts and History in West Columbia, SC?
Top Zip Codes with the Highest Percentage of Population with a Degree in Liberal Arts and History in West Columbia, SC are:
What zip code has the Highest Percentage of Population with a Degree in Liberal Arts and History in West Columbia, SC?
29169 has the Highest Percentage of Population with a Degree in Liberal Arts and History in West Columbia, SC with 7.2%.
What is the Percentage of Population with a Degree in Liberal Arts and History in West Columbia, SC?
Percentage of Population with a Degree in Liberal Arts and History in West Columbia is 7.5%.
What is the Percentage of Population with a Degree in Liberal Arts and History in South Carolina?
Percentage of Population with a Degree in Liberal Arts and History in South Carolina is 5.2%.
What is the Percentage of Population with a Degree in Liberal Arts and History in the United States?
Percentage of Population with a Degree in Liberal Arts and History in the United States is 4.9%.