Zip Codes with the Highest Percentage of Population with a Degree in Liberal Arts and History in Fort Mill, SC
RELATED REPORTS & OPTIONS
Liberal Arts and History
Fort Mill
Compare Zip Codes
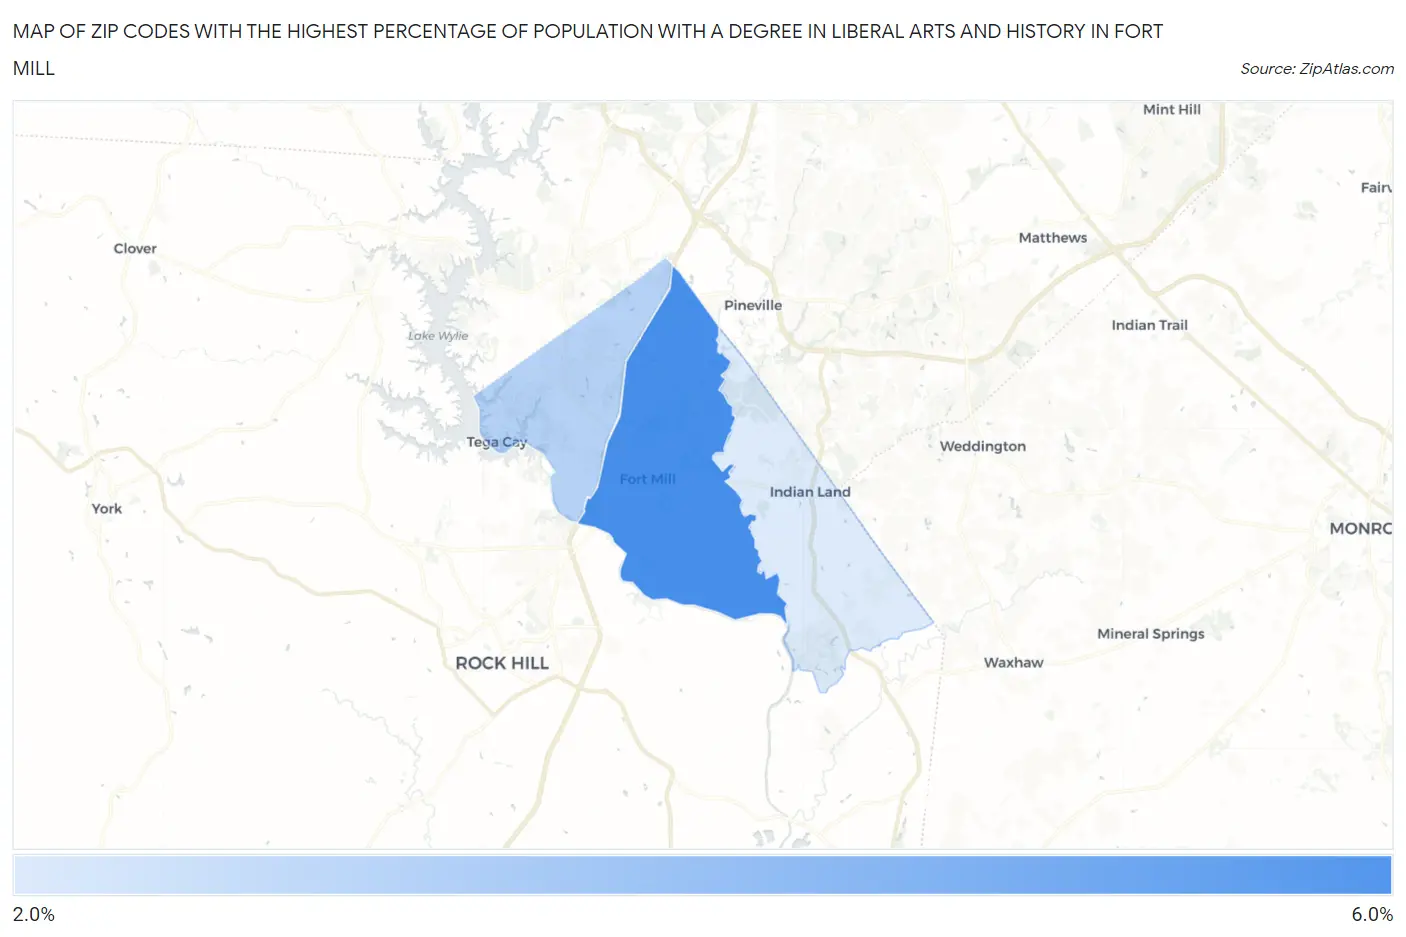
Map of Zip Codes with the Highest Percentage of Population with a Degree in Liberal Arts and History in Fort Mill
2.4%
6.0%
Zip Codes with the Highest Percentage of Population with a Degree in Liberal Arts and History in Fort Mill, SC
| Zip Code | % Graduates | vs State | vs National | |
| 1. | 29715 | 6.0% | 5.2%(+0.768)#128 | 4.9%(+1.09)#8,611 |
| 2. | 29708 | 3.3% | 5.2%(-1.90)#255 | 4.9%(-1.58)#17,333 |
| 3. | 29707 | 2.4% | 5.2%(-2.82)#287 | 4.9%(-2.50)#20,343 |
1
Common Questions
What are the Top Zip Codes with the Highest Percentage of Population with a Degree in Liberal Arts and History in Fort Mill, SC?
Top Zip Codes with the Highest Percentage of Population with a Degree in Liberal Arts and History in Fort Mill, SC are:
What zip code has the Highest Percentage of Population with a Degree in Liberal Arts and History in Fort Mill, SC?
29715 has the Highest Percentage of Population with a Degree in Liberal Arts and History in Fort Mill, SC with 6.0%.
What is the Percentage of Population with a Degree in Liberal Arts and History in Fort Mill, SC?
Percentage of Population with a Degree in Liberal Arts and History in Fort Mill is 6.0%.
What is the Percentage of Population with a Degree in Liberal Arts and History in South Carolina?
Percentage of Population with a Degree in Liberal Arts and History in South Carolina is 5.2%.
What is the Percentage of Population with a Degree in Liberal Arts and History in the United States?
Percentage of Population with a Degree in Liberal Arts and History in the United States is 4.9%.