Zip Codes with the Highest Percentage of Population with a Degree in Liberal Arts and History in Anderson, SC
RELATED REPORTS & OPTIONS
Liberal Arts and History
Anderson
Compare Zip Codes
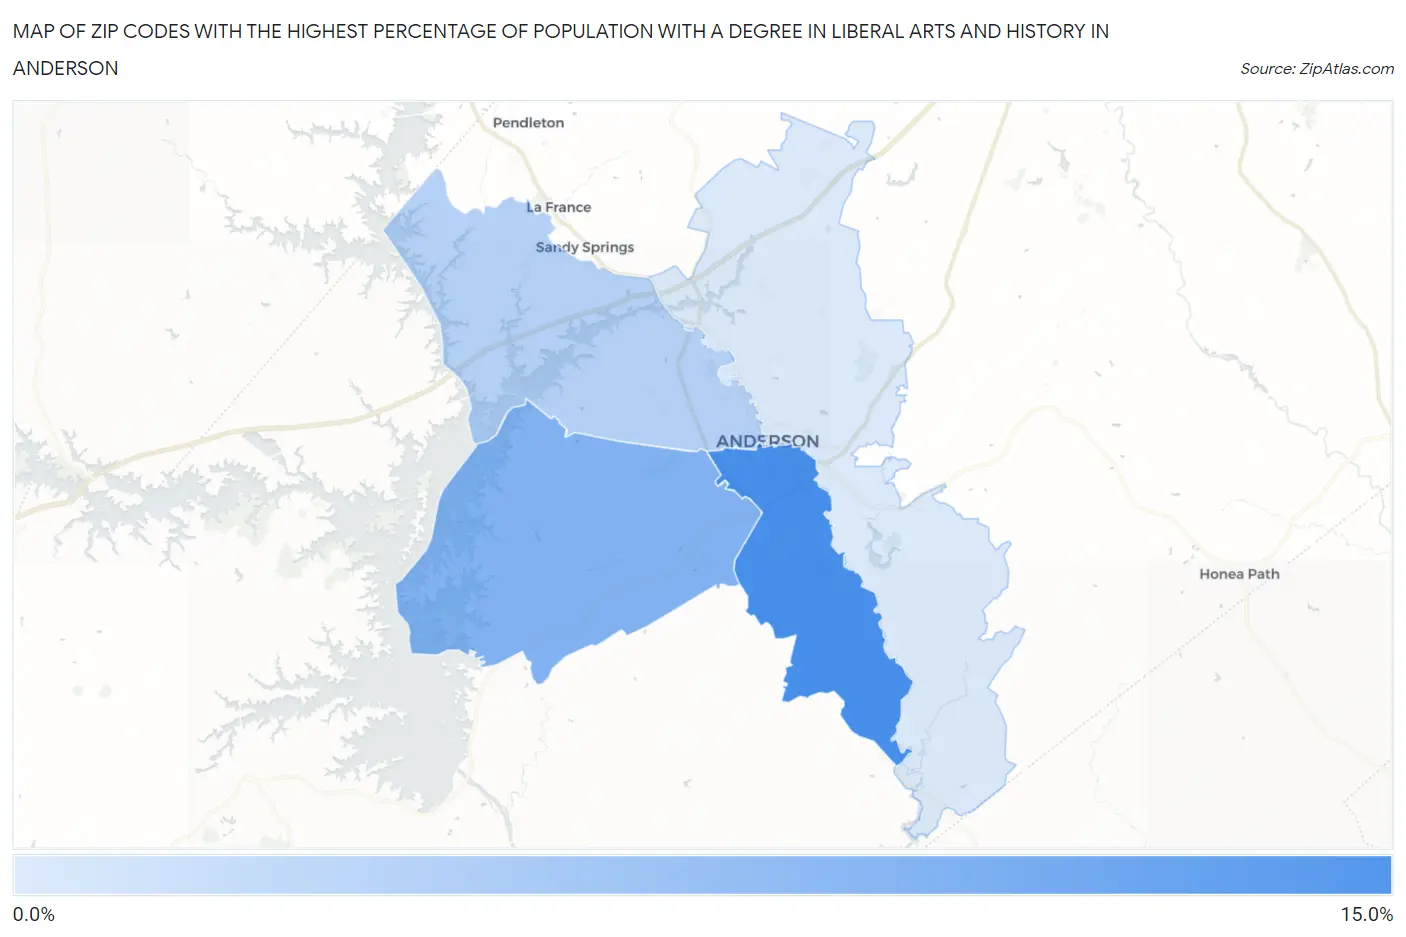
Map of Zip Codes with the Highest Percentage of Population with a Degree in Liberal Arts and History in Anderson
4.9%
13.7%
Zip Codes with the Highest Percentage of Population with a Degree in Liberal Arts and History in Anderson, SC
| Zip Code | % Graduates | vs State | vs National | |
| 1. | 29624 | 13.7% | 5.2%(+8.52)#27 | 4.9%(+8.85)#1,703 |
| 2. | 29626 | 10.0% | 5.2%(+4.83)#53 | 4.9%(+5.16)#3,087 |
| 3. | 29625 | 7.0% | 5.2%(+1.84)#101 | 4.9%(+2.16)#6,330 |
| 4. | 29621 | 4.9% | 5.2%(-0.346)#187 | 4.9%(-0.020)#11,810 |
1
Common Questions
What are the Top 3 Zip Codes with the Highest Percentage of Population with a Degree in Liberal Arts and History in Anderson, SC?
Top 3 Zip Codes with the Highest Percentage of Population with a Degree in Liberal Arts and History in Anderson, SC are:
What zip code has the Highest Percentage of Population with a Degree in Liberal Arts and History in Anderson, SC?
29624 has the Highest Percentage of Population with a Degree in Liberal Arts and History in Anderson, SC with 13.7%.
What is the Percentage of Population with a Degree in Liberal Arts and History in Anderson, SC?
Percentage of Population with a Degree in Liberal Arts and History in Anderson is 5.2%.
What is the Percentage of Population with a Degree in Liberal Arts and History in South Carolina?
Percentage of Population with a Degree in Liberal Arts and History in South Carolina is 5.2%.
What is the Percentage of Population with a Degree in Liberal Arts and History in the United States?
Percentage of Population with a Degree in Liberal Arts and History in the United States is 4.9%.