Zip Codes with the Highest Percentage of Population with a Degree in Liberal Arts and History in Greenville, SC
RELATED REPORTS & OPTIONS
Liberal Arts and History
Greenville
Compare Zip Codes
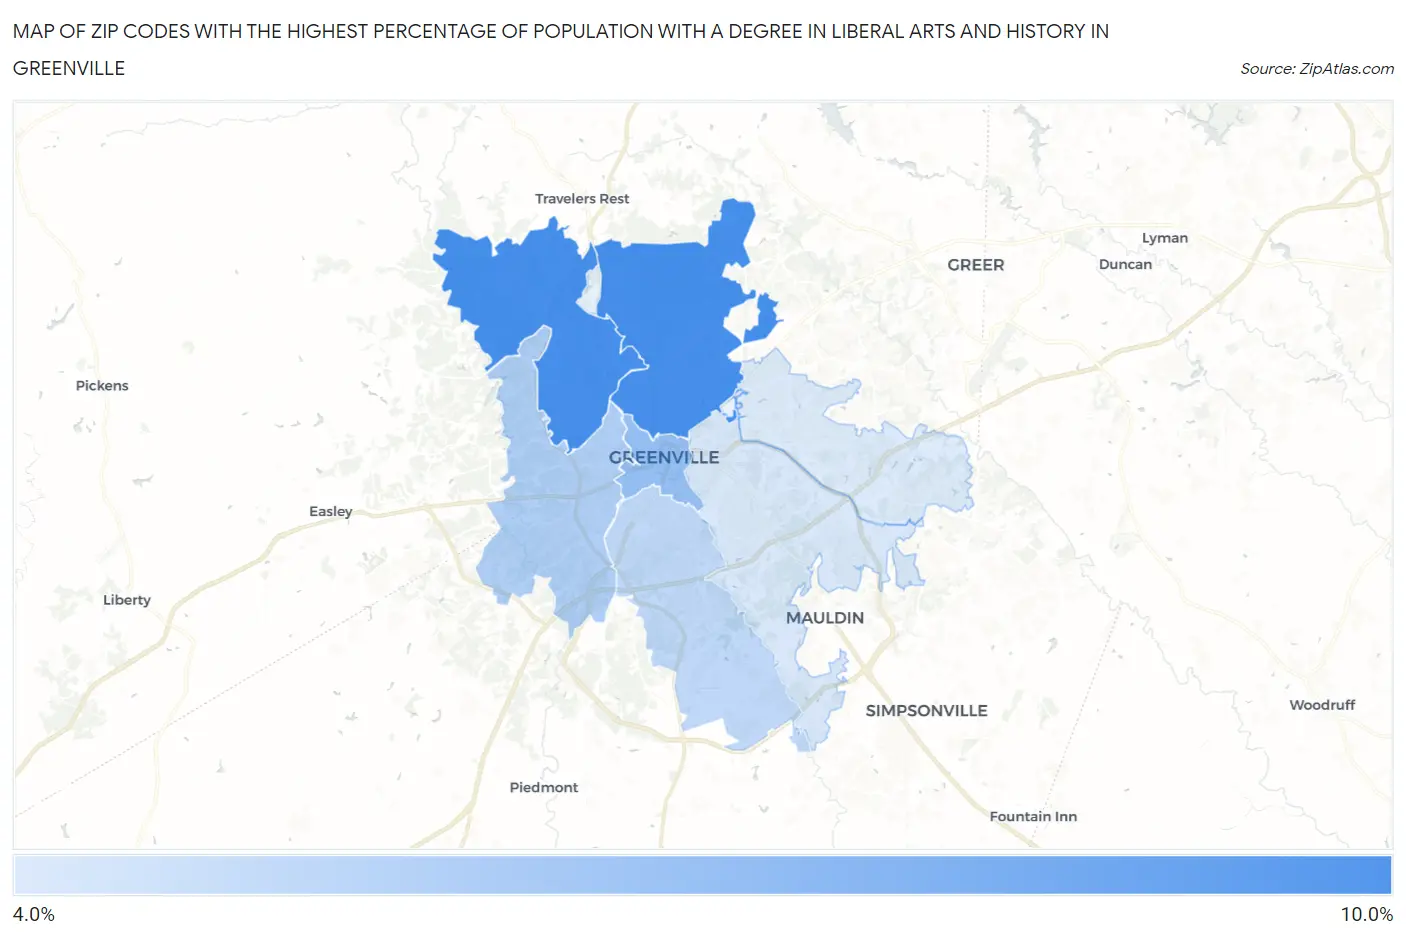
Map of Zip Codes with the Highest Percentage of Population with a Degree in Liberal Arts and History in Greenville
4.9%
8.1%
Zip Codes with the Highest Percentage of Population with a Degree in Liberal Arts and History in Greenville, SC
| Zip Code | % Graduates | vs State | vs National | |
| 1. | 29617 | 8.1% | 5.2%(+2.88)#78 | 4.9%(+3.20)#4,813 |
| 2. | 29609 | 8.1% | 5.2%(+2.86)#80 | 4.9%(+3.18)#4,832 |
| 3. | 29601 | 6.4% | 5.2%(+1.18)#119 | 4.9%(+1.51)#7,605 |
| 4. | 29611 | 5.8% | 5.2%(+0.593)#137 | 4.9%(+0.919)#9,055 |
| 5. | 29605 | 5.5% | 5.2%(+0.316)#153 | 4.9%(+0.642)#9,837 |
| 6. | 29607 | 5.0% | 5.2%(-0.230)#178 | 4.9%(+0.097)#11,439 |
| 7. | 29615 | 4.9% | 5.2%(-0.308)#184 | 4.9%(+0.018)#11,667 |
1
Common Questions
What are the Top 5 Zip Codes with the Highest Percentage of Population with a Degree in Liberal Arts and History in Greenville, SC?
Top 5 Zip Codes with the Highest Percentage of Population with a Degree in Liberal Arts and History in Greenville, SC are:
What zip code has the Highest Percentage of Population with a Degree in Liberal Arts and History in Greenville, SC?
29617 has the Highest Percentage of Population with a Degree in Liberal Arts and History in Greenville, SC with 8.1%.
What is the Percentage of Population with a Degree in Liberal Arts and History in Greenville, SC?
Percentage of Population with a Degree in Liberal Arts and History in Greenville is 6.3%.
What is the Percentage of Population with a Degree in Liberal Arts and History in South Carolina?
Percentage of Population with a Degree in Liberal Arts and History in South Carolina is 5.2%.
What is the Percentage of Population with a Degree in Liberal Arts and History in the United States?
Percentage of Population with a Degree in Liberal Arts and History in the United States is 4.9%.