Zip Codes with the Highest Percentage of Population with a Degree in Visual and Performing Arts in Bayamon, PR
RELATED REPORTS & OPTIONS
Visual and Performing Arts
Bayamon
Compare Zip Codes
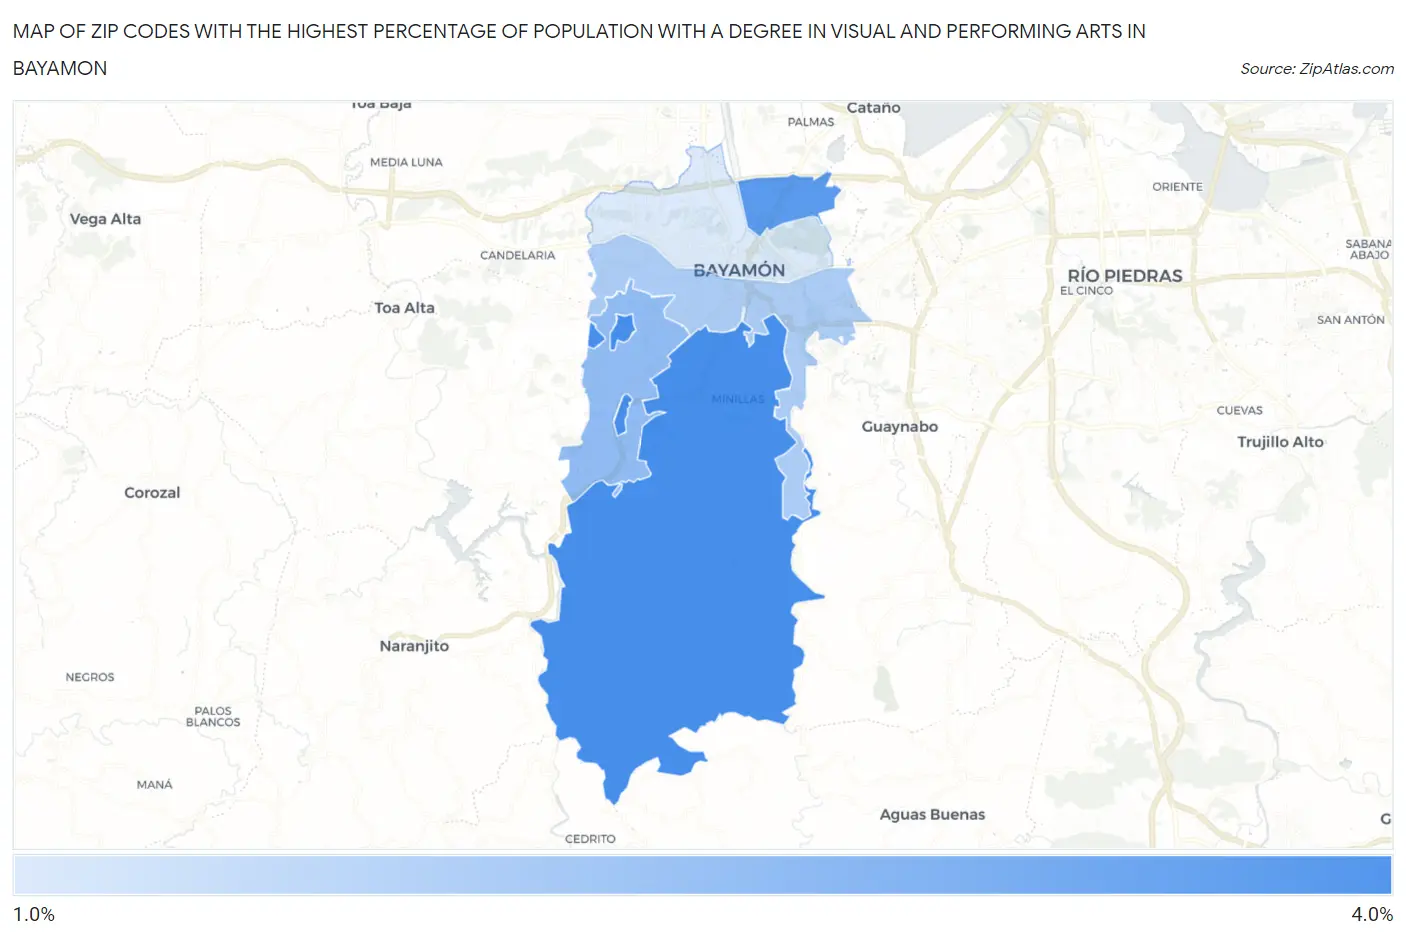
Map of Zip Codes with the Highest Percentage of Population with a Degree in Visual and Performing Arts in Bayamon
1.4%
3.2%
Zip Codes with the Highest Percentage of Population with a Degree in Visual and Performing Arts in Bayamon, PR
| Zip Code | % Graduates | vs State | vs National | |
| 1. | 00956 | 3.2% | 2.1%(+1.08)#24 | 4.3%(-1.02)#11,873 |
| 2. | 00960 | 3.0% | 2.1%(+0.852)#28 | 4.3%(-1.25)#12,727 |
| 3. | 00957 | 2.3% | 2.1%(+0.189)#40 | 4.3%(-1.92)#15,218 |
| 4. | 00959 | 2.0% | 2.1%(-0.154)#53 | 4.3%(-2.26)#16,469 |
| 5. | 00961 | 1.4% | 2.1%(-0.729)#78 | 4.3%(-2.83)#18,402 |
1
Common Questions
What are the Top 3 Zip Codes with the Highest Percentage of Population with a Degree in Visual and Performing Arts in Bayamon, PR?
Top 3 Zip Codes with the Highest Percentage of Population with a Degree in Visual and Performing Arts in Bayamon, PR are:
What zip code has the Highest Percentage of Population with a Degree in Visual and Performing Arts in Bayamon, PR?
00956 has the Highest Percentage of Population with a Degree in Visual and Performing Arts in Bayamon, PR with 3.2%.
What is the Percentage of Population with a Degree in Visual and Performing Arts in Bayamon, PR?
Percentage of Population with a Degree in Visual and Performing Arts in Bayamon is 9.2%.
What is the Percentage of Population with a Degree in Visual and Performing Arts in Puerto Rico?
Percentage of Population with a Degree in Visual and Performing Arts in Puerto Rico is 2.1%.
What is the Percentage of Population with a Degree in Visual and Performing Arts in the United States?
Percentage of Population with a Degree in Visual and Performing Arts in the United States is 4.3%.