Bayamon, PR Map & Demographics
Bayamon Overview
$13,756
PER CAPITA INCOME
$30,428
AVG FAMILY INCOME
$23,224
AVG HOUSEHOLD INCOME
27.8%
WAGE / INCOME GAP [ % ]
72.2¢/ $1
WAGE / INCOME GAP [ $ ]
0.48
INEQUALITY / GINI INDEX
1,654
TOTAL POPULATION
723
MALE POPULATION
931
FEMALE POPULATION
77.66
MALES / 100 FEMALES
128.77
FEMALES / 100 MALES
36.5
MEDIAN AGE
3.4
AVG FAMILY SIZE
2.6
AVG HOUSEHOLD SIZE
572
LABOR FORCE [ PEOPLE ]
44.3%
PERCENT IN LABOR FORCE
12.7%
UNEMPLOYMENT RATE
Income in Bayamon
Income Overview in Bayamon
Per Capita Income in Bayamon is $13,756, while median incomes of families and households are $30,428 and $23,224 respectively.
| Characteristic | Number | Measure |
| Per Capita Income | 1,654 | $13,756 |
| Median Family Income | 387 | $30,428 |
| Mean Family Income | 387 | $38,194 |
| Median Household Income | 623 | $23,224 |
| Mean Household Income | 623 | $34,145 |
| Income Deficit | 387 | $0 |
| Wage / Income Gap (%) | 1,654 | 27.80% |
| Wage / Income Gap ($) | 1,654 | 72.20¢ per $1 |
| Gini / Inequality Index | 1,654 | 0.48 |
Earnings by Sex in Bayamon
Average Earnings in Bayamon are $18,393, $17,052 for men and $23,618 for women, a difference of 27.8%.
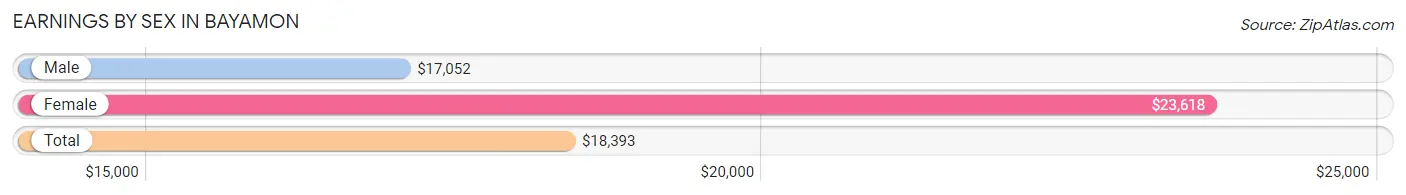
| Sex | Number | Average Earnings |
| Male | 295 (50.0%) | $17,052 |
| Female | 295 (50.0%) | $23,618 |
| Total | 590 (100.0%) | $18,393 |
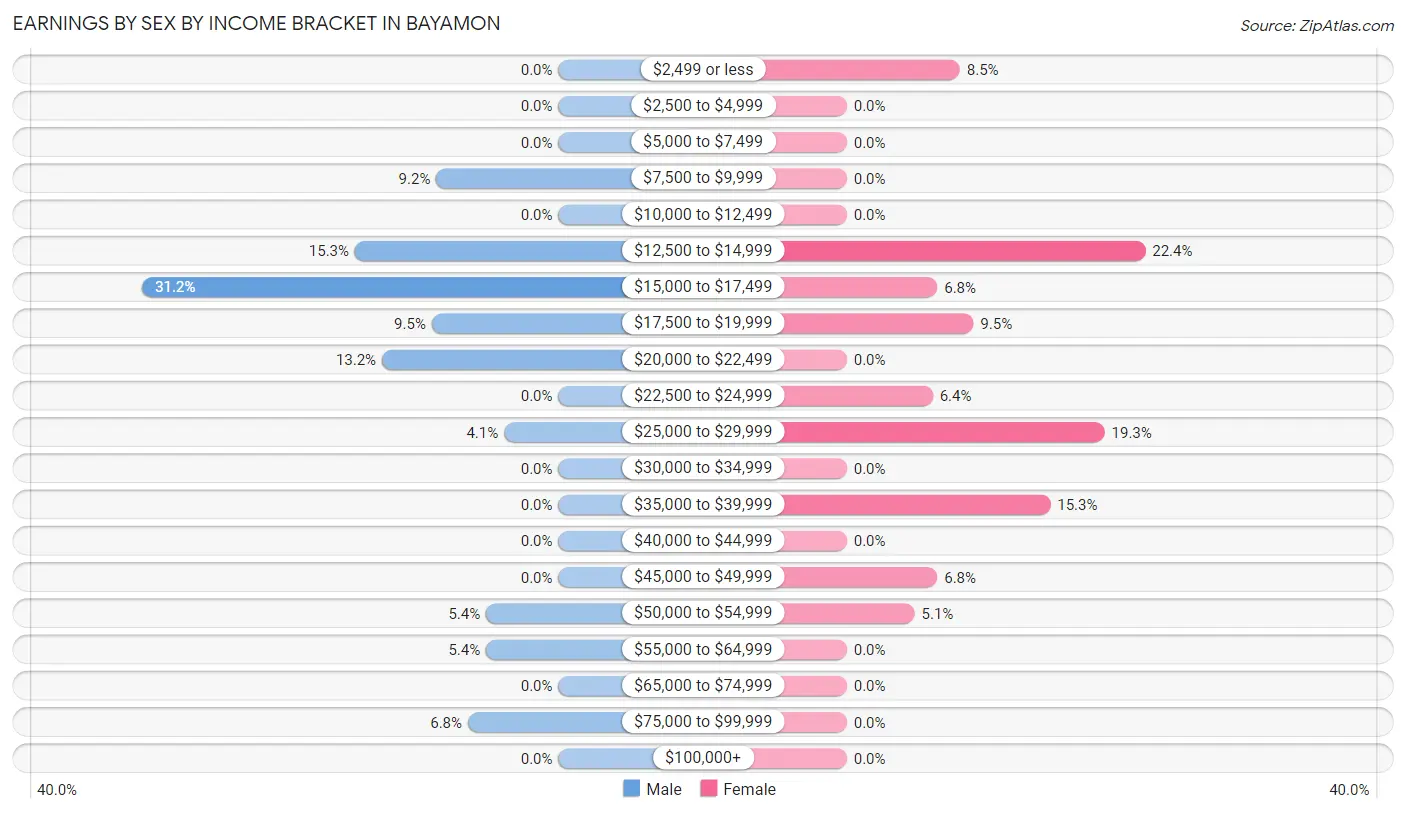
Earnings by Sex by Income Bracket in Bayamon
The most common earnings brackets in Bayamon are $15,000 to $17,499 for men (92 | 31.2%) and $12,500 to $14,999 for women (66 | 22.4%).
| Income | Male | Female |
| $2,499 or less | 0 (0.0%) | 25 (8.5%) |
| $2,500 to $4,999 | 0 (0.0%) | 0 (0.0%) |
| $5,000 to $7,499 | 0 (0.0%) | 0 (0.0%) |
| $7,500 to $9,999 | 27 (9.1%) | 0 (0.0%) |
| $10,000 to $12,499 | 0 (0.0%) | 0 (0.0%) |
| $12,500 to $14,999 | 45 (15.2%) | 66 (22.4%) |
| $15,000 to $17,499 | 92 (31.2%) | 20 (6.8%) |
| $17,500 to $19,999 | 28 (9.5%) | 28 (9.5%) |
| $20,000 to $22,499 | 39 (13.2%) | 0 (0.0%) |
| $22,500 to $24,999 | 0 (0.0%) | 19 (6.4%) |
| $25,000 to $29,999 | 12 (4.1%) | 57 (19.3%) |
| $30,000 to $34,999 | 0 (0.0%) | 0 (0.0%) |
| $35,000 to $39,999 | 0 (0.0%) | 45 (15.2%) |
| $40,000 to $44,999 | 0 (0.0%) | 0 (0.0%) |
| $45,000 to $49,999 | 0 (0.0%) | 20 (6.8%) |
| $50,000 to $54,999 | 16 (5.4%) | 15 (5.1%) |
| $55,000 to $64,999 | 16 (5.4%) | 0 (0.0%) |
| $65,000 to $74,999 | 0 (0.0%) | 0 (0.0%) |
| $75,000 to $99,999 | 20 (6.8%) | 0 (0.0%) |
| $100,000+ | 0 (0.0%) | 0 (0.0%) |
| Total | 295 (100.0%) | 295 (100.0%) |
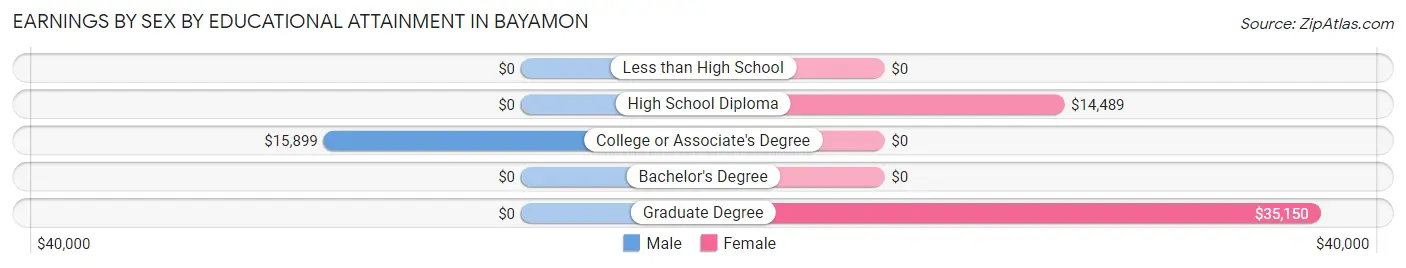
Earnings by Sex by Educational Attainment in Bayamon
Average earnings in Bayamon are $17,418 for men and $23,618 for women, a difference of 26.3%. Men with an educational attainment of college or associate's degree enjoy the highest average annual earnings of $15,899, while those with college or associate's degree education earn the least with $15,899. Women with an educational attainment of graduate degree earn the most with the average annual earnings of $35,150, while those with high school diploma education have the smallest earnings of $14,489.
| Educational Attainment | Male Income | Female Income |
| Less than High School | - | - |
| High School Diploma | - | - |
| College or Associate's Degree | $15,899 | $0 |
| Bachelor's Degree | - | - |
| Graduate Degree | - | - |
| Total | $17,418 | $23,618 |
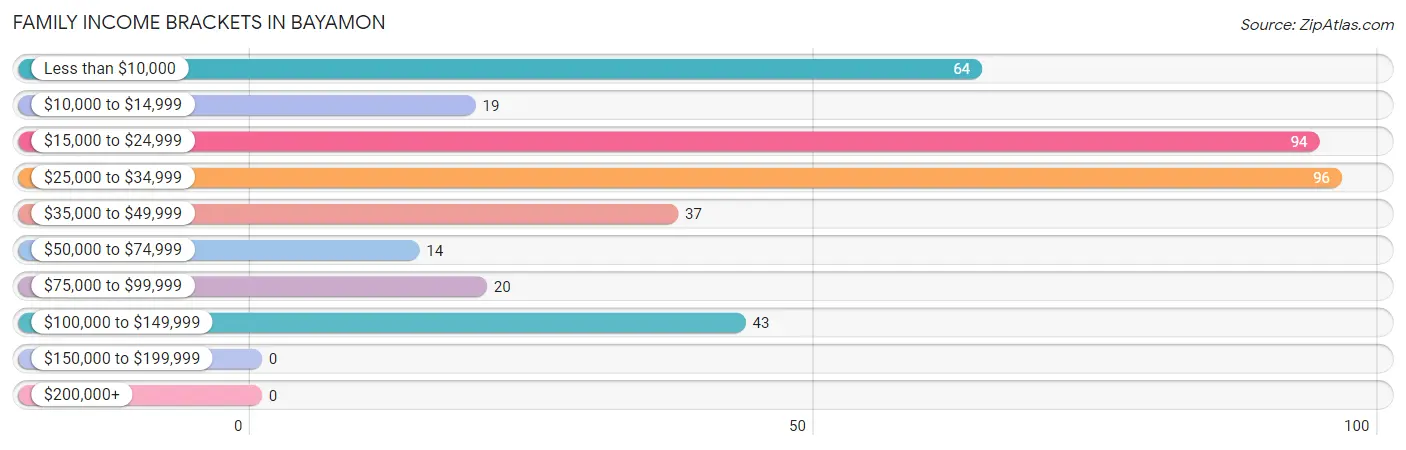
Family Income in Bayamon
Family Income Brackets in Bayamon
According to the Bayamon family income data, there are 96 families falling into the $25,000 to $34,999 income range, which is the most common income bracket and makes up 24.8% of all families.
| Income Bracket | # Families | % Families |
| Less than $10,000 | 64 | 16.5% |
| $10,000 to $14,999 | 19 | 4.9% |
| $15,000 to $24,999 | 94 | 24.3% |
| $25,000 to $34,999 | 96 | 24.8% |
| $35,000 to $49,999 | 37 | 9.6% |
| $50,000 to $74,999 | 14 | 3.6% |
| $75,000 to $99,999 | 20 | 5.2% |
| $100,000 to $149,999 | 43 | 11.1% |
| $150,000 to $199,999 | 0 | 0.0% |
| $200,000+ | 0 | 0.0% |
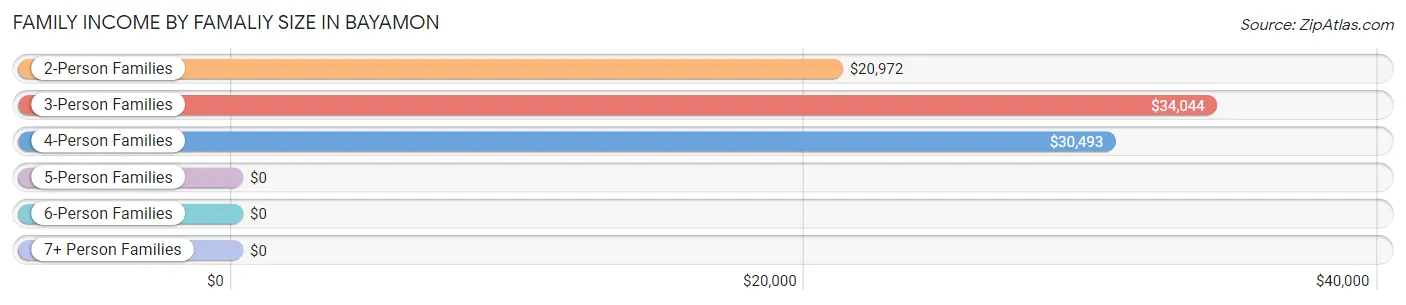
Family Income by Famaliy Size in Bayamon
3-person families (167 | 43.1%) account for the highest median family income in Bayamon with $34,044 per family, while 3-person families (167 | 43.1%) have the highest median income of $11,348 per family member.
| Income Bracket | # Families | Median Income |
| 2-Person Families | 136 (35.1%) | $20,972 |
| 3-Person Families | 167 (43.1%) | $34,044 |
| 4-Person Families | 61 (15.8%) | $30,493 |
| 5-Person Families | 23 (5.9%) | $0 |
| 6-Person Families | 0 (0.0%) | $0 |
| 7+ Person Families | 0 (0.0%) | $0 |
| Total | 387 (100.0%) | $30,428 |
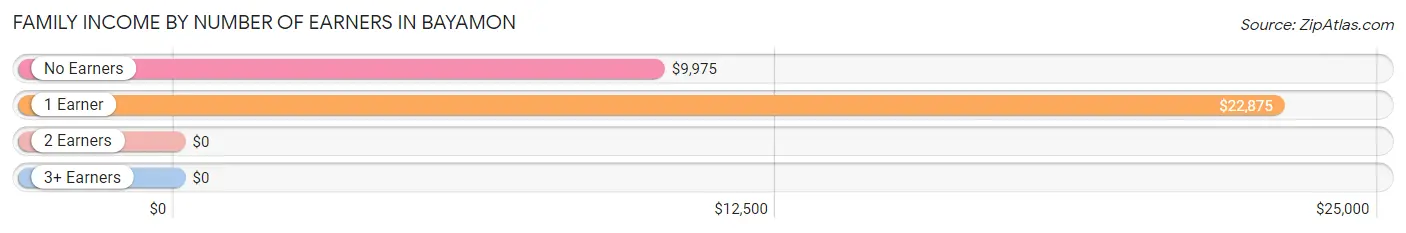
Family Income by Number of Earners in Bayamon
| Number of Earners | # Families | Median Income |
| No Earners | 127 (32.8%) | $9,975 |
| 1 Earner | 94 (24.3%) | $22,875 |
| 2 Earners | 166 (42.9%) | $0 |
| 3+ Earners | 0 (0.0%) | $0 |
| Total | 387 (100.0%) | $30,428 |
Household Income in Bayamon
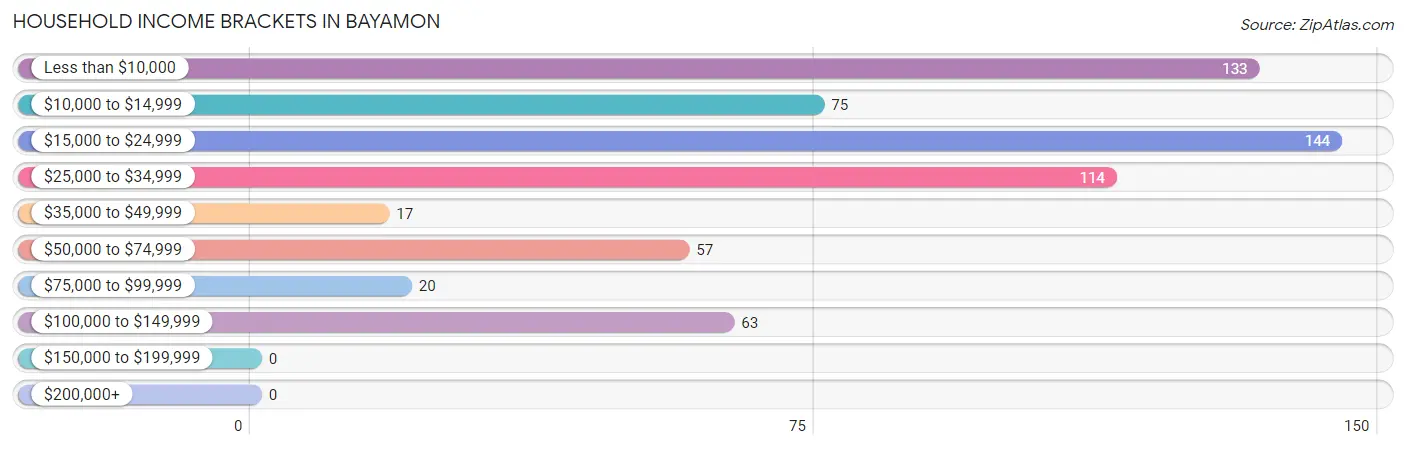
Household Income Brackets in Bayamon
With 144 households falling in the category, the $15,000 to $24,999 income range is the most frequent in Bayamon, accounting for 23.1% of all households.
| Income Bracket | # Households | % Households |
| Less than $10,000 | 133 | 21.3% |
| $10,000 to $14,999 | 75 | 12.0% |
| $15,000 to $24,999 | 144 | 23.1% |
| $25,000 to $34,999 | 114 | 18.3% |
| $35,000 to $49,999 | 17 | 2.7% |
| $50,000 to $74,999 | 57 | 9.1% |
| $75,000 to $99,999 | 20 | 3.2% |
| $100,000 to $149,999 | 63 | 10.1% |
| $150,000 to $199,999 | 0 | 0.0% |
| $200,000+ | 0 | 0.0% |
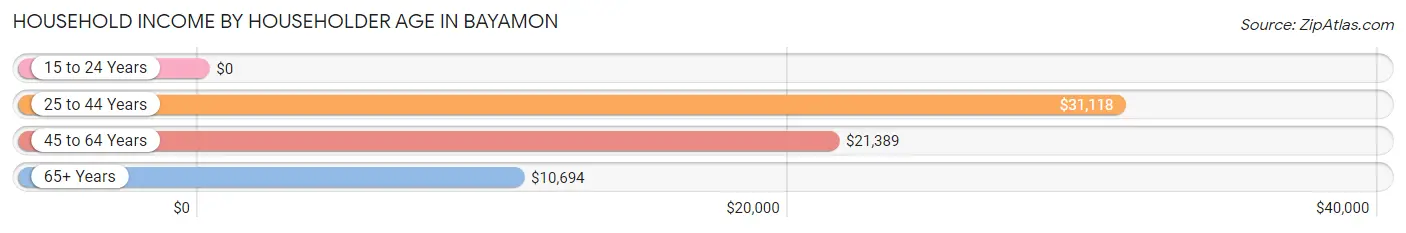
Household Income by Householder Age in Bayamon
The median household income in Bayamon is $23,224, with the highest median household income of $31,118 found in the 25 to 44 years age bracket for the primary householder. A total of 198 households (31.8%) fall into this category.
| Income Bracket | # Households | Median Income |
| 15 to 24 Years | 0 (0.0%) | $0 |
| 25 to 44 Years | 198 (31.8%) | $31,118 |
| 45 to 64 Years | 246 (39.5%) | $21,389 |
| 65+ Years | 179 (28.7%) | $10,694 |
| Total | 623 (100.0%) | $23,224 |
Poverty in Bayamon
Income Below Poverty by Sex and Age in Bayamon
With 40.5% poverty level for males and 34.5% for females among the residents of Bayamon, 12 to 14 year old males and under 5 year old females are the most vulnerable to poverty, with 36 males (100.0%) and 26 females (100.0%) in their respective age groups living below the poverty level.
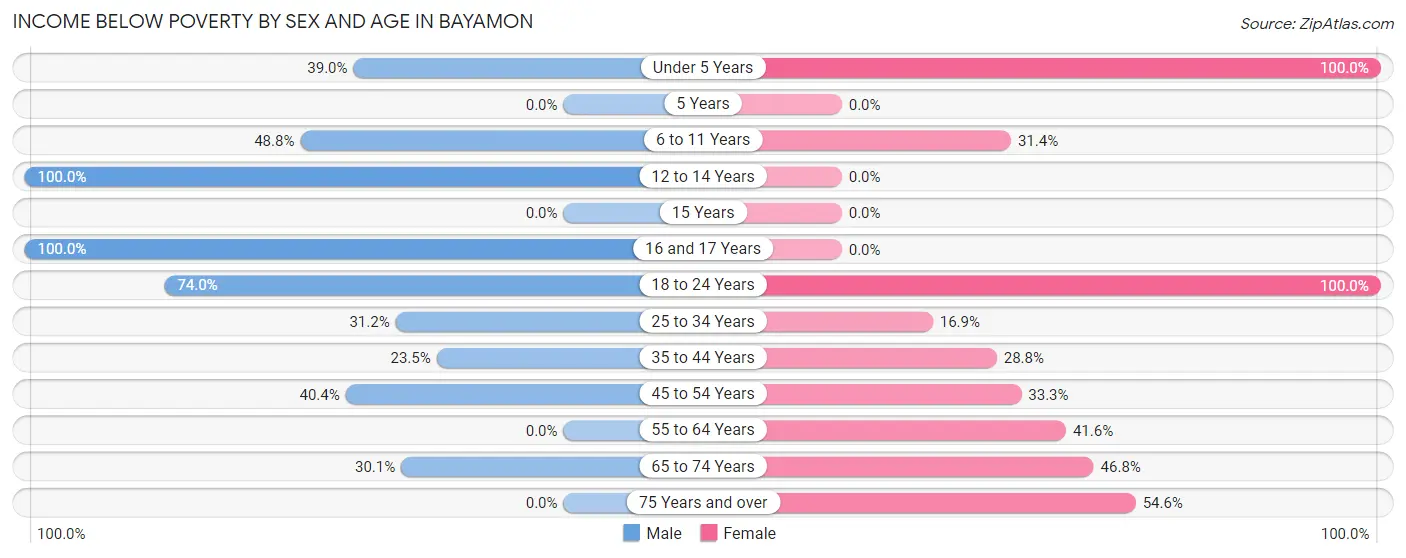
| Age Bracket | Male | Female |
| Under 5 Years | 23 (39.0%) | 26 (100.0%) |
| 5 Years | 0 (0.0%) | 0 (0.0%) |
| 6 to 11 Years | 21 (48.8%) | 27 (31.4%) |
| 12 to 14 Years | 36 (100.0%) | 0 (0.0%) |
| 15 Years | 0 (0.0%) | 0 (0.0%) |
| 16 and 17 Years | 14 (100.0%) | 0 (0.0%) |
| 18 to 24 Years | 77 (74.0%) | 22 (100.0%) |
| 25 to 34 Years | 43 (31.2%) | 25 (16.9%) |
| 35 to 44 Years | 16 (23.5%) | 42 (28.8%) |
| 45 to 54 Years | 38 (40.4%) | 33 (33.3%) |
| 55 to 64 Years | 0 (0.0%) | 62 (41.6%) |
| 65 to 74 Years | 25 (30.1%) | 36 (46.8%) |
| 75 Years and over | 0 (0.0%) | 48 (54.5%) |
| Total | 293 (40.5%) | 321 (34.5%) |
Income Above Poverty by Sex and Age in Bayamon
According to the poverty statistics in Bayamon, males aged 15 years and females aged 5 years are the age groups that are most secure financially, with 100.0% of males and 100.0% of females in these age groups living above the poverty line.
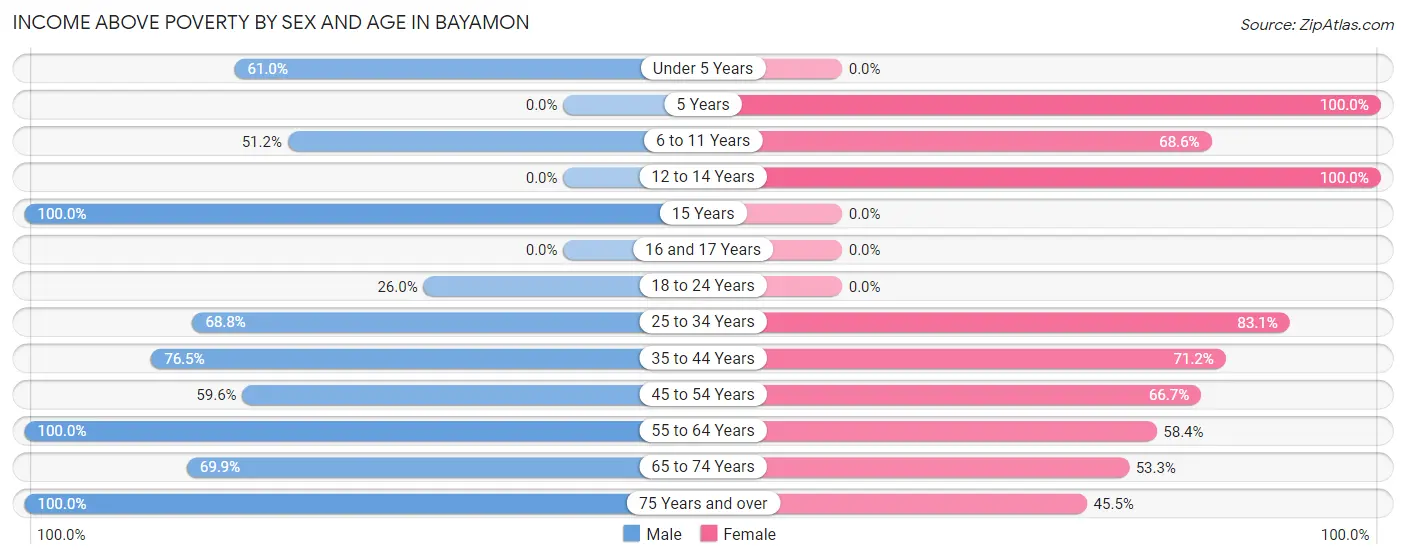
| Age Bracket | Male | Female |
| Under 5 Years | 36 (61.0%) | 0 (0.0%) |
| 5 Years | 0 (0.0%) | 63 (100.0%) |
| 6 to 11 Years | 22 (51.2%) | 59 (68.6%) |
| 12 to 14 Years | 0 (0.0%) | 27 (100.0%) |
| 15 Years | 22 (100.0%) | 0 (0.0%) |
| 16 and 17 Years | 0 (0.0%) | 0 (0.0%) |
| 18 to 24 Years | 27 (26.0%) | 0 (0.0%) |
| 25 to 34 Years | 95 (68.8%) | 123 (83.1%) |
| 35 to 44 Years | 52 (76.5%) | 104 (71.2%) |
| 45 to 54 Years | 56 (59.6%) | 66 (66.7%) |
| 55 to 64 Years | 49 (100.0%) | 87 (58.4%) |
| 65 to 74 Years | 58 (69.9%) | 41 (53.2%) |
| 75 Years and over | 13 (100.0%) | 40 (45.5%) |
| Total | 430 (59.5%) | 610 (65.5%) |
Income Below Poverty Among Married-Couple Families in Bayamon
The poverty statistics for married-couple families in Bayamon show that 19.9% or 52 of the total 262 families live below the poverty line. Families with no children have the highest poverty rate of 24.1%, comprising of 42 families. On the other hand, families with 1 or 2 children have the lowest poverty rate of 11.4%, which includes 10 families.
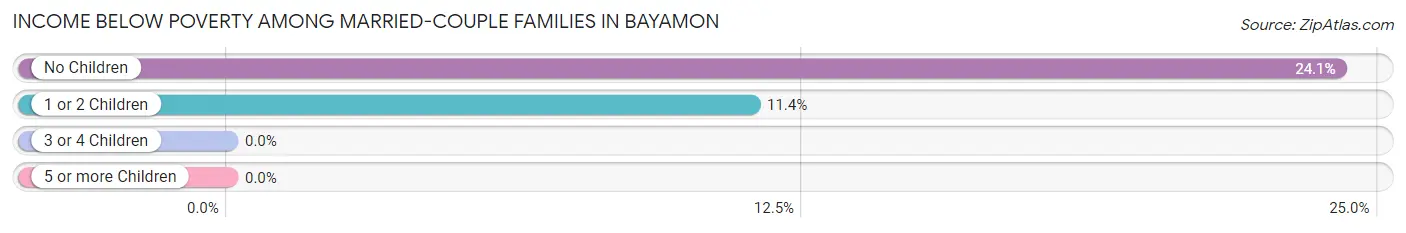
| Children | Above Poverty | Below Poverty |
| No Children | 132 (75.9%) | 42 (24.1%) |
| 1 or 2 Children | 78 (88.6%) | 10 (11.4%) |
| 3 or 4 Children | 0 (0.0%) | 0 (0.0%) |
| 5 or more Children | 0 (0.0%) | 0 (0.0%) |
| Total | 210 (80.1%) | 52 (19.9%) |
Income Below Poverty Among Single-Parent Households in Bayamon
According to the poverty data in Bayamon, 100.0% or 18 single-father households and 62.6% or 67 single-mother households are living below the poverty line. Among single-father households, those with 1 or 2 children have the highest poverty rate, with 18 households (100.0%) experiencing poverty. Likewise, among single-mother households, those with no children have the highest poverty rate, with 33 households (100.0%) falling below the poverty line.
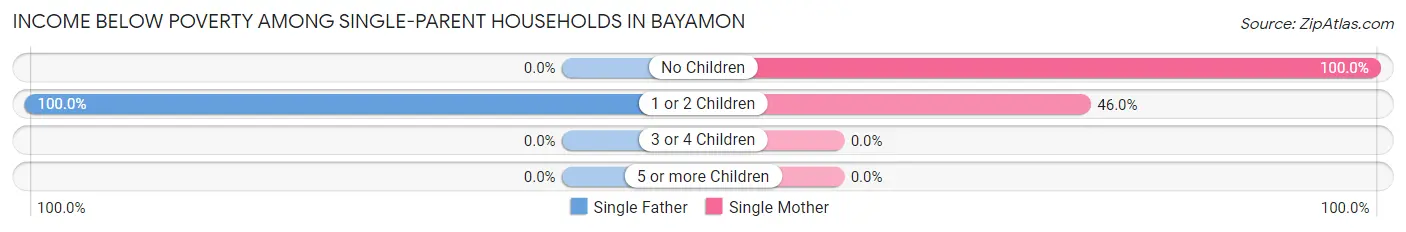
| Children | Single Father | Single Mother |
| No Children | 0 (0.0%) | 33 (100.0%) |
| 1 or 2 Children | 18 (100.0%) | 34 (46.0%) |
| 3 or 4 Children | 0 (0.0%) | 0 (0.0%) |
| 5 or more Children | 0 (0.0%) | 0 (0.0%) |
| Total | 18 (100.0%) | 67 (62.6%) |
Income Below Poverty Among Married-Couple vs Single-Parent Households in Bayamon
The poverty data for Bayamon shows that 52 of the married-couple family households (19.9%) and 85 of the single-parent households (68.0%) are living below the poverty level. Within the married-couple family households, those with no children have the highest poverty rate, with 42 households (24.1%) falling below the poverty line. Among the single-parent households, those with no children have the highest poverty rate, with 33 household (100.0%) living below poverty.
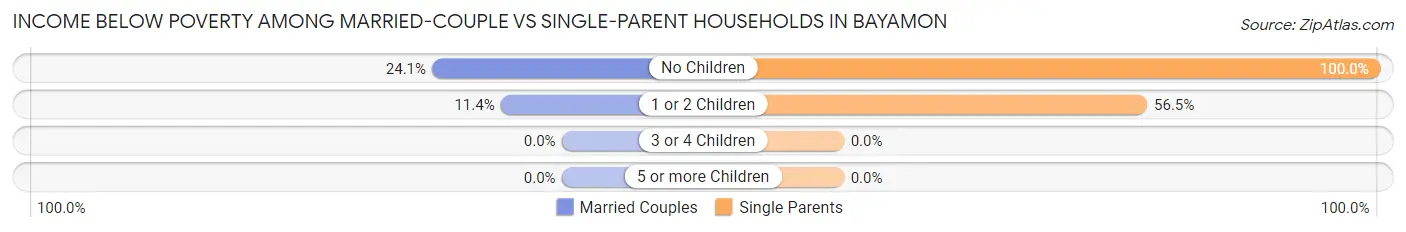
| Children | Married-Couple Families | Single-Parent Households |
| No Children | 42 (24.1%) | 33 (100.0%) |
| 1 or 2 Children | 10 (11.4%) | 52 (56.5%) |
| 3 or 4 Children | 0 (0.0%) | 0 (0.0%) |
| 5 or more Children | 0 (0.0%) | 0 (0.0%) |
| Total | 52 (19.9%) | 85 (68.0%) |
Race in Bayamon
The most populous races in Bayamon are Hispanic or Latino (1,654 | 100.0%), White / Caucasian (635 | 38.4%), and Some other Race (631 | 38.2%).
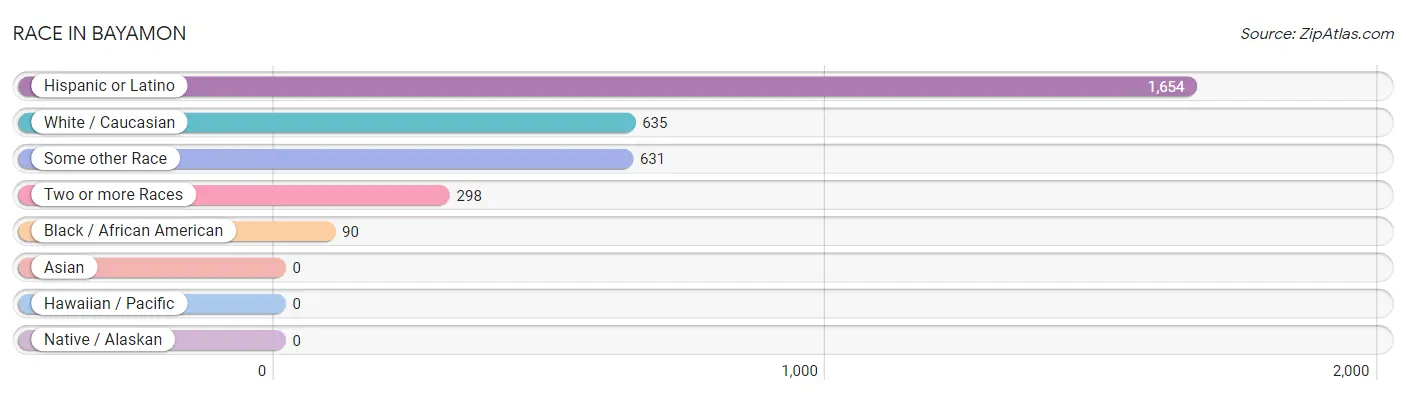
| Race | # Population | % Population |
| Asian | 0 | 0.0% |
| Black / African American | 90 | 5.4% |
| Hawaiian / Pacific | 0 | 0.0% |
| Hispanic or Latino | 1,654 | 100.0% |
| Native / Alaskan | 0 | 0.0% |
| White / Caucasian | 635 | 38.4% |
| Two or more Races | 298 | 18.0% |
| Some other Race | 631 | 38.2% |
| Total | 1,654 | 100.0% |
Ancestry in Bayamon
The most populous ancestries reported in Bayamon are Puerto Rican (1,584 | 95.8%), Dominican (70 | 4.2%), and American (22 | 1.3%), together accounting for 101.3% of all Bayamon residents.
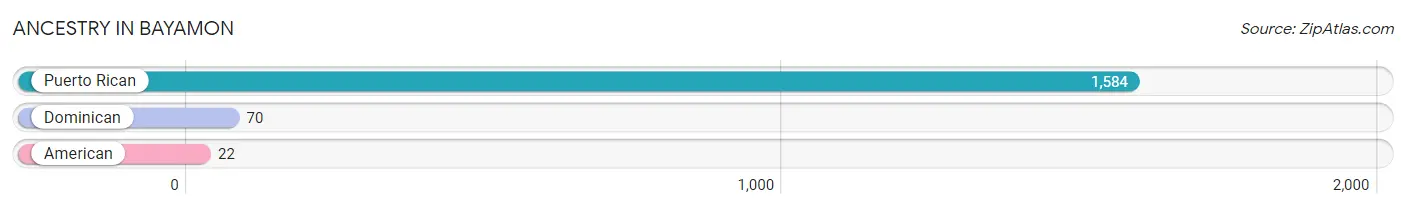
| Ancestry | # Population | % Population |
| American | 22 | 1.3% |
| Dominican | 70 | 4.2% |
| Puerto Rican | 1,584 | 95.8% | View All 3 Rows |
Immigrants in Bayamon

| Immigration Origin | # Population | % Population | View All 0 Rows |
Sex and Age in Bayamon
Sex and Age in Bayamon
The most populous age groups in Bayamon are 30 to 34 Years (110 | 15.2%) for men and 5 to 9 Years (124 | 13.3%) for women.
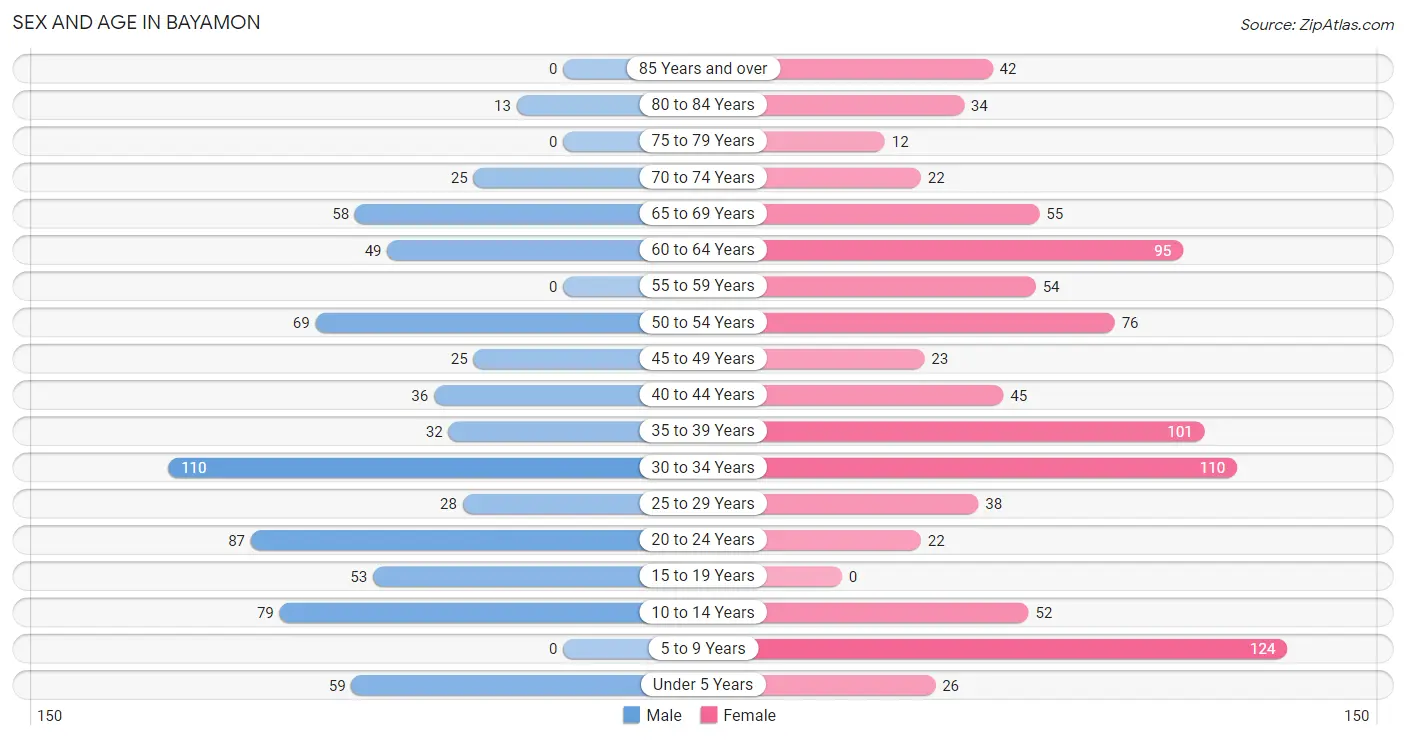
| Age Bracket | Male | Female |
| Under 5 Years | 59 (8.2%) | 26 (2.8%) |
| 5 to 9 Years | 0 (0.0%) | 124 (13.3%) |
| 10 to 14 Years | 79 (10.9%) | 52 (5.6%) |
| 15 to 19 Years | 53 (7.3%) | 0 (0.0%) |
| 20 to 24 Years | 87 (12.0%) | 22 (2.4%) |
| 25 to 29 Years | 28 (3.9%) | 38 (4.1%) |
| 30 to 34 Years | 110 (15.2%) | 110 (11.8%) |
| 35 to 39 Years | 32 (4.4%) | 101 (10.8%) |
| 40 to 44 Years | 36 (5.0%) | 45 (4.8%) |
| 45 to 49 Years | 25 (3.5%) | 23 (2.5%) |
| 50 to 54 Years | 69 (9.5%) | 76 (8.2%) |
| 55 to 59 Years | 0 (0.0%) | 54 (5.8%) |
| 60 to 64 Years | 49 (6.8%) | 95 (10.2%) |
| 65 to 69 Years | 58 (8.0%) | 55 (5.9%) |
| 70 to 74 Years | 25 (3.5%) | 22 (2.4%) |
| 75 to 79 Years | 0 (0.0%) | 12 (1.3%) |
| 80 to 84 Years | 13 (1.8%) | 34 (3.6%) |
| 85 Years and over | 0 (0.0%) | 42 (4.5%) |
| Total | 723 (100.0%) | 931 (100.0%) |
Families and Households in Bayamon
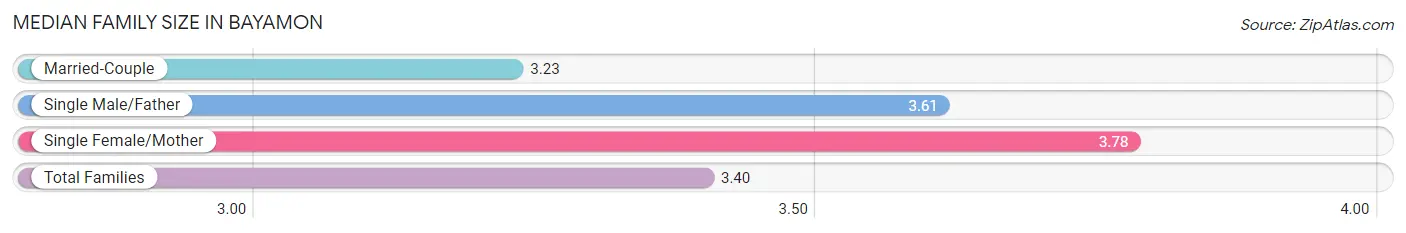
Median Family Size in Bayamon
The median family size in Bayamon is 3.40 persons per family, with single female/mother families (107 | 27.7%) accounting for the largest median family size of 3.78 persons per family. On the other hand, married-couple families (262 | 67.7%) represent the smallest median family size with 3.23 persons per family.
| Family Type | # Families | Family Size |
| Married-Couple | 262 (67.7%) | 3.23 |
| Single Male/Father | 18 (4.6%) | 3.61 |
| Single Female/Mother | 107 (27.7%) | 3.78 |
| Total Families | 387 (100.0%) | 3.40 |
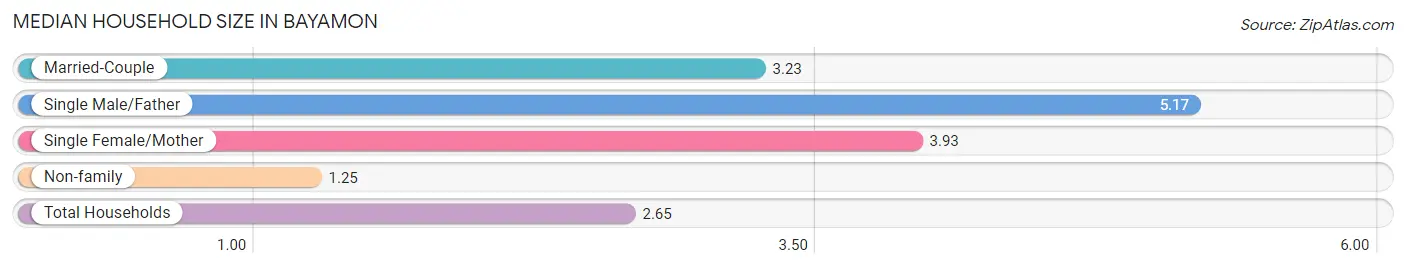
Median Household Size in Bayamon
The median household size in Bayamon is 2.65 persons per household, with single male/father households (18 | 2.9%) accounting for the largest median household size of 5.17 persons per household. non-family households (236 | 37.9%) represent the smallest median household size with 1.25 persons per household.
| Household Type | # Households | Household Size |
| Married-Couple | 262 (42.0%) | 3.23 |
| Single Male/Father | 18 (2.9%) | 5.17 |
| Single Female/Mother | 107 (17.2%) | 3.93 |
| Non-family | 236 (37.9%) | 1.25 |
| Total Households | 623 (100.0%) | 2.65 |
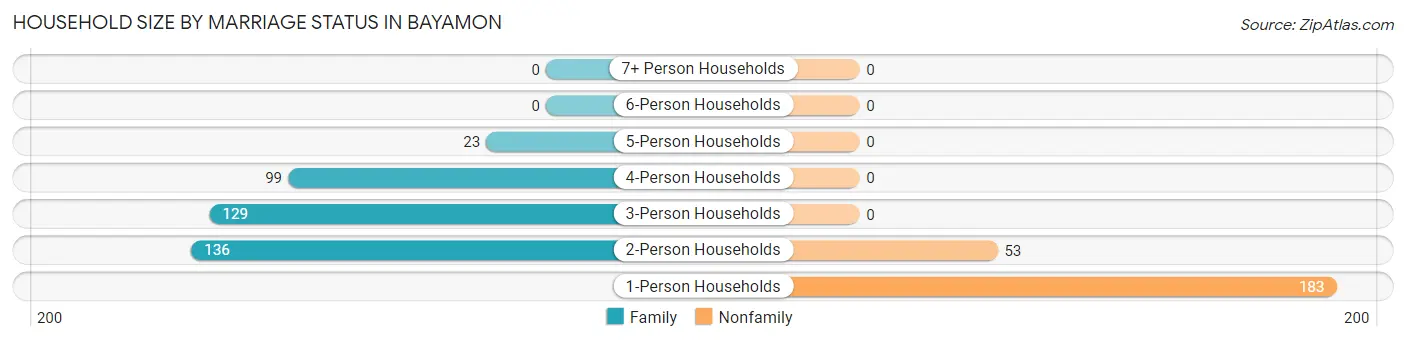
Household Size by Marriage Status in Bayamon
Out of a total of 623 households in Bayamon, 387 (62.1%) are family households, while 236 (37.9%) are nonfamily households. The most numerous type of family households are 2-person households, comprising 136, and the most common type of nonfamily households are 1-person households, comprising 183.
| Household Size | Family Households | Nonfamily Households |
| 1-Person Households | - | 183 (29.4%) |
| 2-Person Households | 136 (21.8%) | 53 (8.5%) |
| 3-Person Households | 129 (20.7%) | 0 (0.0%) |
| 4-Person Households | 99 (15.9%) | 0 (0.0%) |
| 5-Person Households | 23 (3.7%) | 0 (0.0%) |
| 6-Person Households | 0 (0.0%) | 0 (0.0%) |
| 7+ Person Households | 0 (0.0%) | 0 (0.0%) |
| Total | 387 (62.1%) | 236 (37.9%) |
Female Fertility in Bayamon
Fertility by Age in Bayamon
| Age Bracket | Women with Births | Births / 1,000 Women |
| 15 to 19 years | 0 (0.0%) | 0.0 |
| 20 to 34 years | 0 (0.0%) | 0.0 |
| 35 to 50 years | 0 (0.0%) | 0.0 |
| Total | 0 (0.0%) | 0.0 |
Fertility by Age by Marriage Status in Bayamon
| Age Bracket | Married | Unmarried |
| 15 to 19 years | 0 (0.0%) | 0 (0.0%) |
| 20 to 34 years | 0 (0.0%) | 0 (0.0%) |
| 35 to 50 years | 0 (0.0%) | 0 (0.0%) |
| Total | 0 (0.0%) | 0 (0.0%) |
Fertility by Education in Bayamon
| Educational Attainment | Women with Births | Births / 1,000 Women |
| Less than High School | 0 (0.0%) | 0.0 |
| High School Diploma | 0 (0.0%) | 0.0 |
| College or Associate's Degree | 0 (0.0%) | 0.0 |
| Bachelor's Degree | 0 (0.0%) | 0.0 |
| Graduate Degree | 0 (0.0%) | 0.0 |
| Total | 0 (0.0%) | 0.0 |
Fertility by Education by Marriage Status in Bayamon
| Educational Attainment | Married | Unmarried |
| Less than High School | 0 (0.0%) | 0 (0.0%) |
| High School Diploma | 0 (0.0%) | 0 (0.0%) |
| College or Associate's Degree | 0 (0.0%) | 0 (0.0%) |
| Bachelor's Degree | 0 (0.0%) | 0 (0.0%) |
| Graduate Degree | 0 (0.0%) | 0 (0.0%) |
| Total | 0 (0.0%) | 0 (0.0%) |
Employment Characteristics in Bayamon
Employment by Class of Employer in Bayamon
Among the 500 employed individuals in Bayamon, private company employees (311 | 62.2%), self-employed (not incorporated) (128 | 25.6%), and state government employees (25 | 5.0%) make up the most common classes of employment.
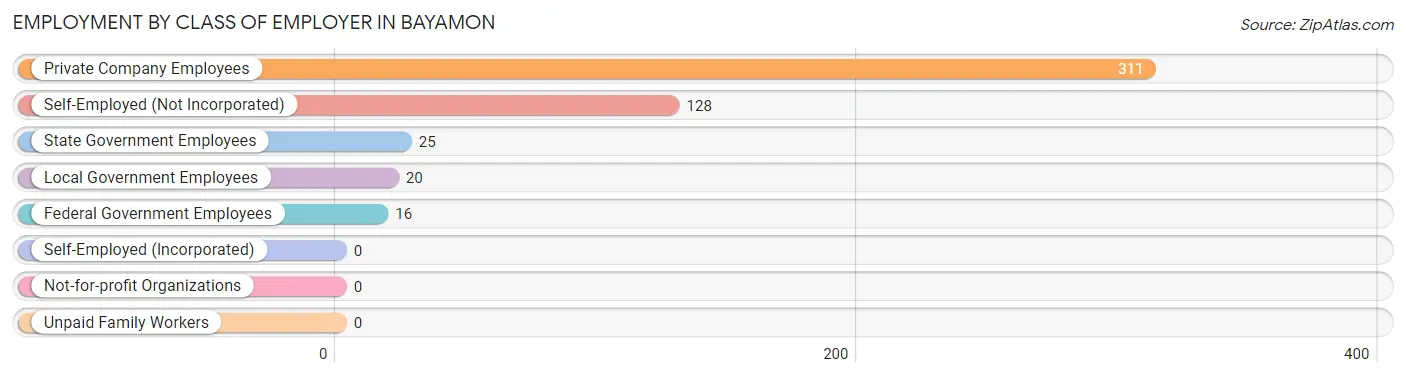
| Employer Class | # Employees | % Employees |
| Private Company Employees | 311 | 62.2% |
| Self-Employed (Incorporated) | 0 | 0.0% |
| Self-Employed (Not Incorporated) | 128 | 25.6% |
| Not-for-profit Organizations | 0 | 0.0% |
| Local Government Employees | 20 | 4.0% |
| State Government Employees | 25 | 5.0% |
| Federal Government Employees | 16 | 3.2% |
| Unpaid Family Workers | 0 | 0.0% |
| Total | 500 | 100.0% |
Employment Status by Age in Bayamon
According to the labor force statistics for Bayamon, out of the total population over 16 years of age (1,292), 44.3% or 572 individuals are in the labor force, with 12.7% or 73 of them unemployed. The age group with the highest labor force participation rate is 30 to 34 years, with 88.6% or 195 individuals in the labor force. Within the labor force, the 20 to 24 years age range has the highest percentage of unemployed individuals, with 100.0% or 48 of them being unemployed.
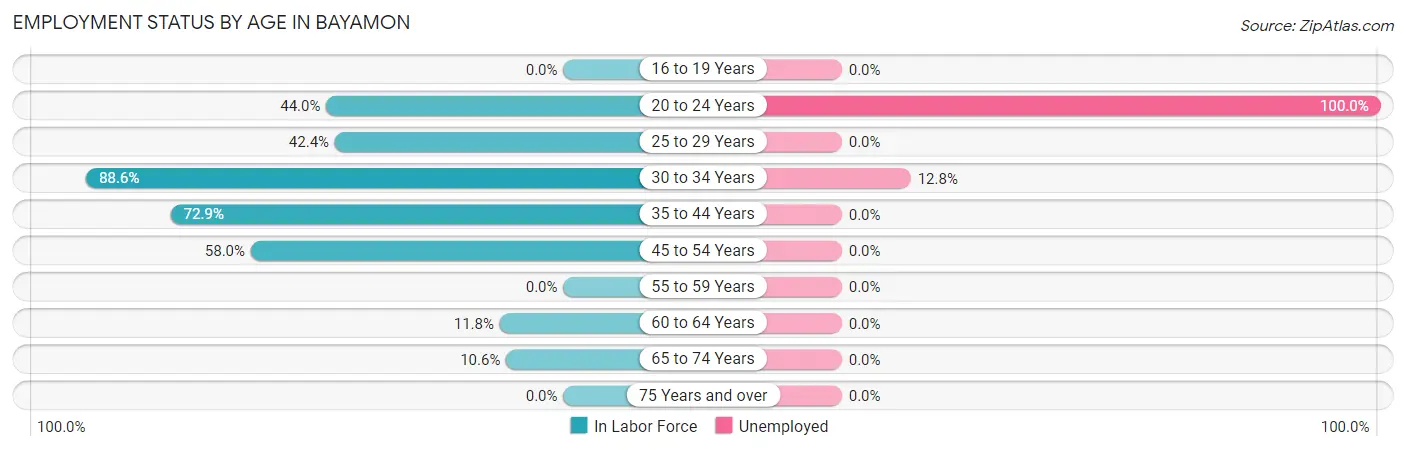
| Age Bracket | In Labor Force | Unemployed |
| 16 to 19 Years | 0 (0.0%) | 0 (0.0%) |
| 20 to 24 Years | 48 (44.0%) | 48 (100.0%) |
| 25 to 29 Years | 28 (42.4%) | 0 (0.0%) |
| 30 to 34 Years | 195 (88.6%) | 25 (12.8%) |
| 35 to 44 Years | 156 (72.9%) | 0 (0.0%) |
| 45 to 54 Years | 112 (58.0%) | 0 (0.0%) |
| 55 to 59 Years | 0 (0.0%) | 0 (0.0%) |
| 60 to 64 Years | 17 (11.8%) | 0 (0.0%) |
| 65 to 74 Years | 17 (10.6%) | 0 (0.0%) |
| 75 Years and over | 0 (0.0%) | 0 (0.0%) |
| Total | 572 (44.3%) | 73 (12.7%) |
Employment Status by Educational Attainment in Bayamon
According to labor force statistics for Bayamon, 57.0% of individuals (508) out of the total population between 25 and 64 years of age (891) are in the labor force, with 4.9% or 25 of them being unemployed. The group with the highest labor force participation rate are those with the educational attainment of bachelor's degree or higher, with 80.7% or 284 individuals in the labor force. Within the labor force, individuals with college / associate degree education have the highest percentage of unemployment, with 20.5% or 25 of them being unemployed.
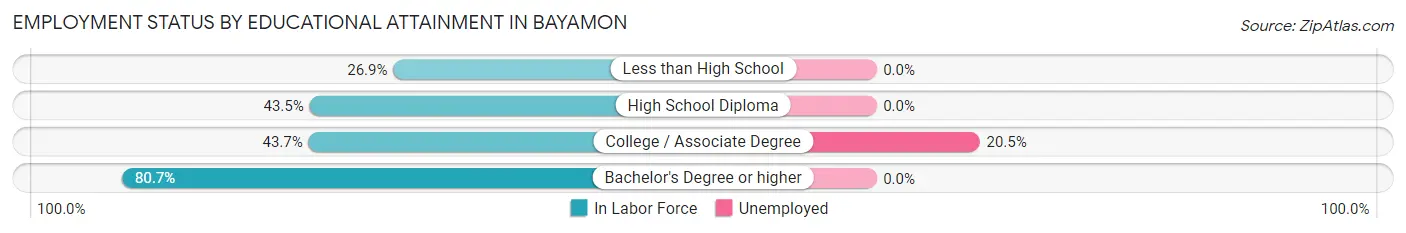
| Educational Attainment | In Labor Force | Unemployed |
| Less than High School | 18 (26.9%) | 0 (0.0%) |
| High School Diploma | 84 (43.5%) | 0 (0.0%) |
| College / Associate Degree | 122 (43.7%) | 57 (20.5%) |
| Bachelor's Degree or higher | 284 (80.7%) | 0 (0.0%) |
| Total | 508 (57.0%) | 44 (4.9%) |
Employment Occupations by Sex in Bayamon
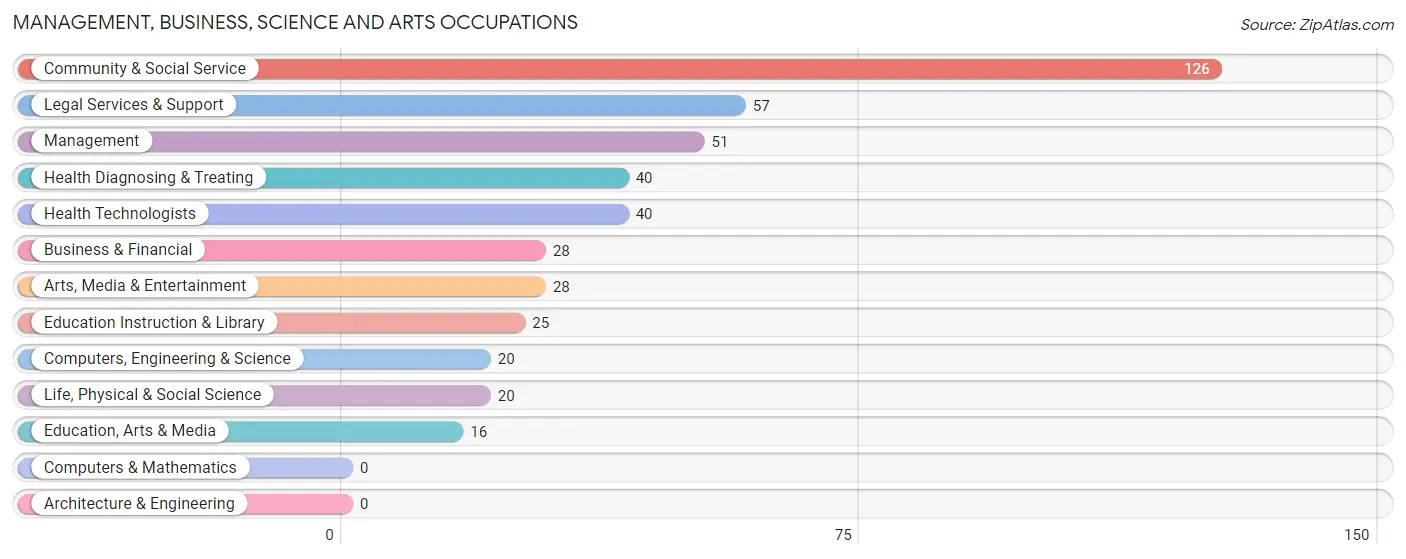
Management, Business, Science and Arts Occupations
The most common Management, Business, Science and Arts occupations in Bayamon are Community & Social Service (126 | 25.2%), Legal Services & Support (57 | 11.4%), Management (51 | 10.2%), Health Diagnosing & Treating (40 | 8.0%), and Health Technologists (40 | 8.0%).
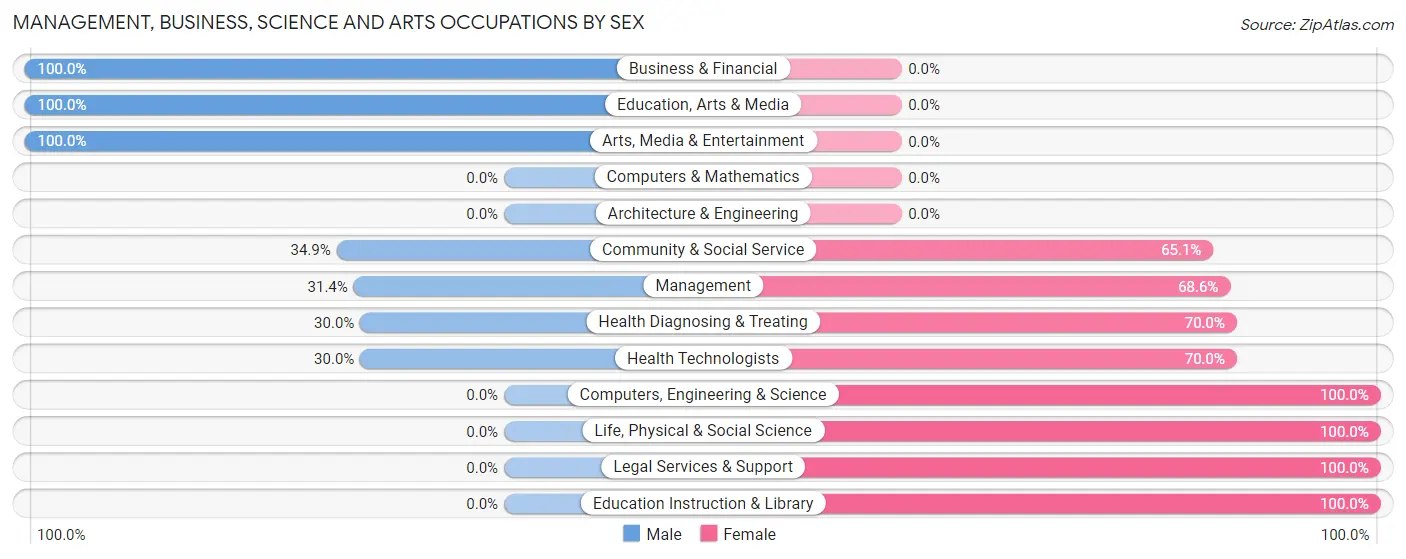
Management, Business, Science and Arts Occupations by Sex
Within the Management, Business, Science and Arts occupations in Bayamon, the most male-oriented occupations are Business & Financial (100.0%), Education, Arts & Media (100.0%), and Arts, Media & Entertainment (100.0%), while the most female-oriented occupations are Computers, Engineering & Science (100.0%), Life, Physical & Social Science (100.0%), and Legal Services & Support (100.0%).
| Occupation | Male | Female |
| Management | 16 (31.4%) | 35 (68.6%) |
| Business & Financial | 28 (100.0%) | 0 (0.0%) |
| Computers, Engineering & Science | 0 (0.0%) | 20 (100.0%) |
| Computers & Mathematics | 0 (0.0%) | 0 (0.0%) |
| Architecture & Engineering | 0 (0.0%) | 0 (0.0%) |
| Life, Physical & Social Science | 0 (0.0%) | 20 (100.0%) |
| Community & Social Service | 44 (34.9%) | 82 (65.1%) |
| Education, Arts & Media | 16 (100.0%) | 0 (0.0%) |
| Legal Services & Support | 0 (0.0%) | 57 (100.0%) |
| Education Instruction & Library | 0 (0.0%) | 25 (100.0%) |
| Arts, Media & Entertainment | 28 (100.0%) | 0 (0.0%) |
| Health Diagnosing & Treating | 12 (30.0%) | 28 (70.0%) |
| Health Technologists | 12 (30.0%) | 28 (70.0%) |
| Total (Category) | 100 (37.7%) | 165 (62.3%) |
| Total (Overall) | 268 (53.6%) | 232 (46.4%) |
Services Occupations
The most common Services occupations in Bayamon are Security & Protection (48 | 9.6%), and Firefighting & Prevention (48 | 9.6%).
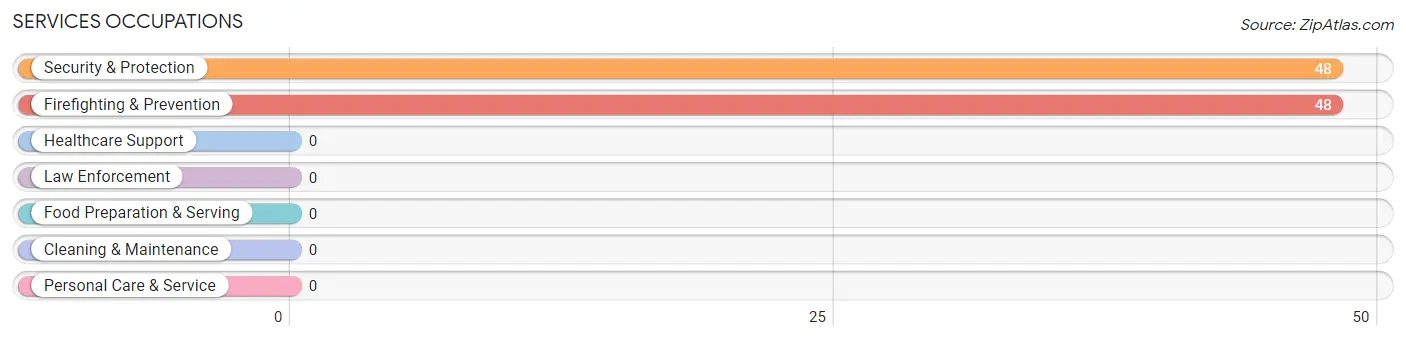
Services Occupations by Sex
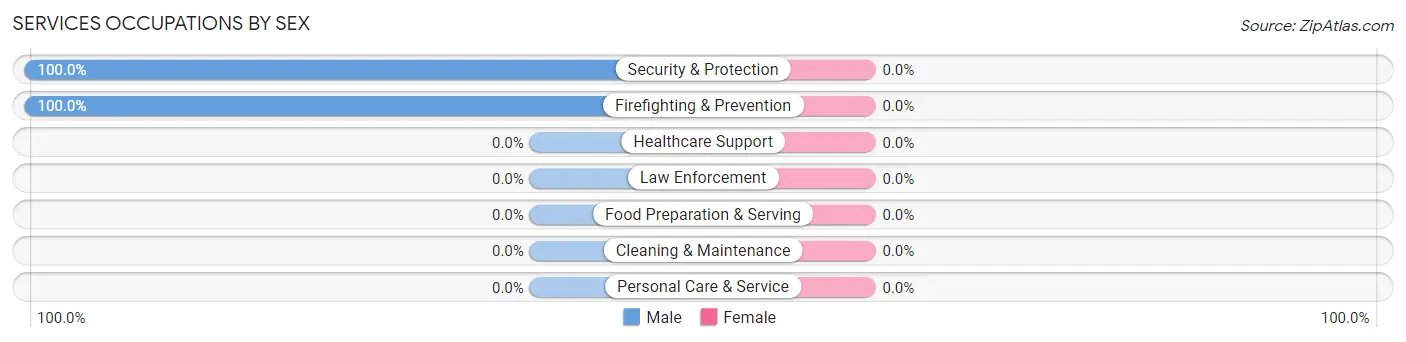
| Occupation | Male | Female |
| Healthcare Support | 0 (0.0%) | 0 (0.0%) |
| Security & Protection | 48 (100.0%) | 0 (0.0%) |
| Firefighting & Prevention | 48 (100.0%) | 0 (0.0%) |
| Law Enforcement | 0 (0.0%) | 0 (0.0%) |
| Food Preparation & Serving | 0 (0.0%) | 0 (0.0%) |
| Cleaning & Maintenance | 0 (0.0%) | 0 (0.0%) |
| Personal Care & Service | 0 (0.0%) | 0 (0.0%) |
| Total (Category) | 48 (100.0%) | 0 (0.0%) |
| Total (Overall) | 268 (53.6%) | 232 (46.4%) |
Sales and Office Occupations
The most common Sales and Office occupations in Bayamon are , and Sales & Related (112 | 22.4%).
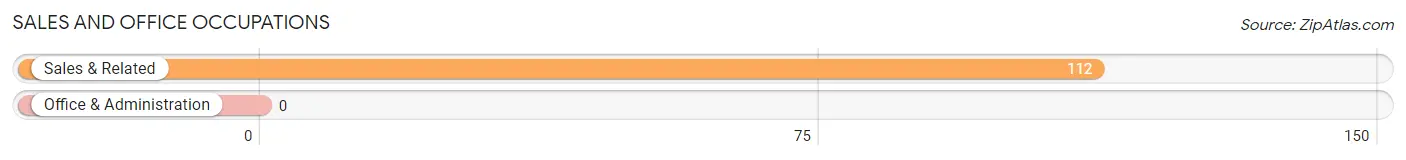
Sales and Office Occupations by Sex
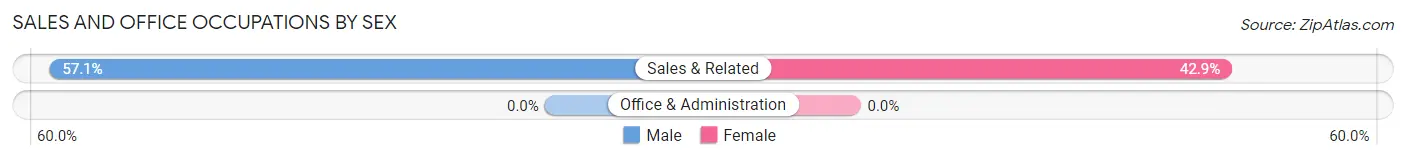
| Occupation | Male | Female |
| Sales & Related | 64 (57.1%) | 48 (42.9%) |
| Office & Administration | 0 (0.0%) | 0 (0.0%) |
| Total (Category) | 64 (57.1%) | 48 (42.9%) |
| Total (Overall) | 268 (53.6%) | 232 (46.4%) |
Natural Resources, Construction and Maintenance Occupations
Natural Resources, Construction and Maintenance Occupations by Sex
| Occupation | Male | Female |
| Farming, Fishing & Forestry | 0 (0.0%) | 0 (0.0%) |
| Construction & Extraction | 0 (0.0%) | 0 (0.0%) |
| Installation, Maintenance & Repair | 0 (0.0%) | 0 (0.0%) |
| Total (Category) | 0 (0.0%) | 0 (0.0%) |
| Total (Overall) | 268 (53.6%) | 232 (46.4%) |
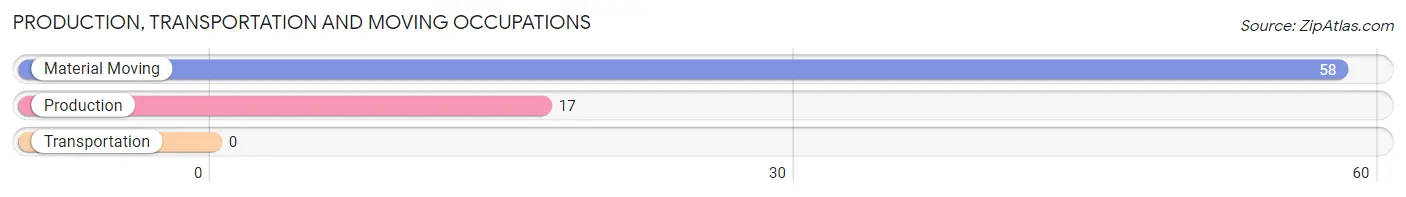
Production, Transportation and Moving Occupations
The most common Production, Transportation and Moving occupations in Bayamon are Material Moving (58 | 11.6%), and Production (17 | 3.4%).
Production, Transportation and Moving Occupations by Sex
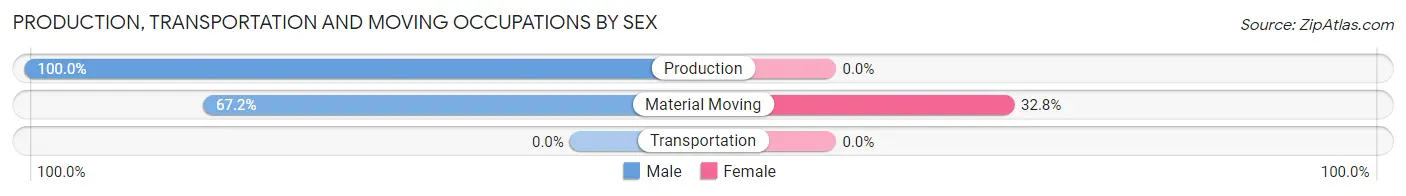
| Occupation | Male | Female |
| Production | 17 (100.0%) | 0 (0.0%) |
| Transportation | 0 (0.0%) | 0 (0.0%) |
| Material Moving | 39 (67.2%) | 19 (32.8%) |
| Total (Category) | 56 (74.7%) | 19 (25.3%) |
| Total (Overall) | 268 (53.6%) | 232 (46.4%) |
Employment Industries by Sex in Bayamon
Employment Industries in Bayamon
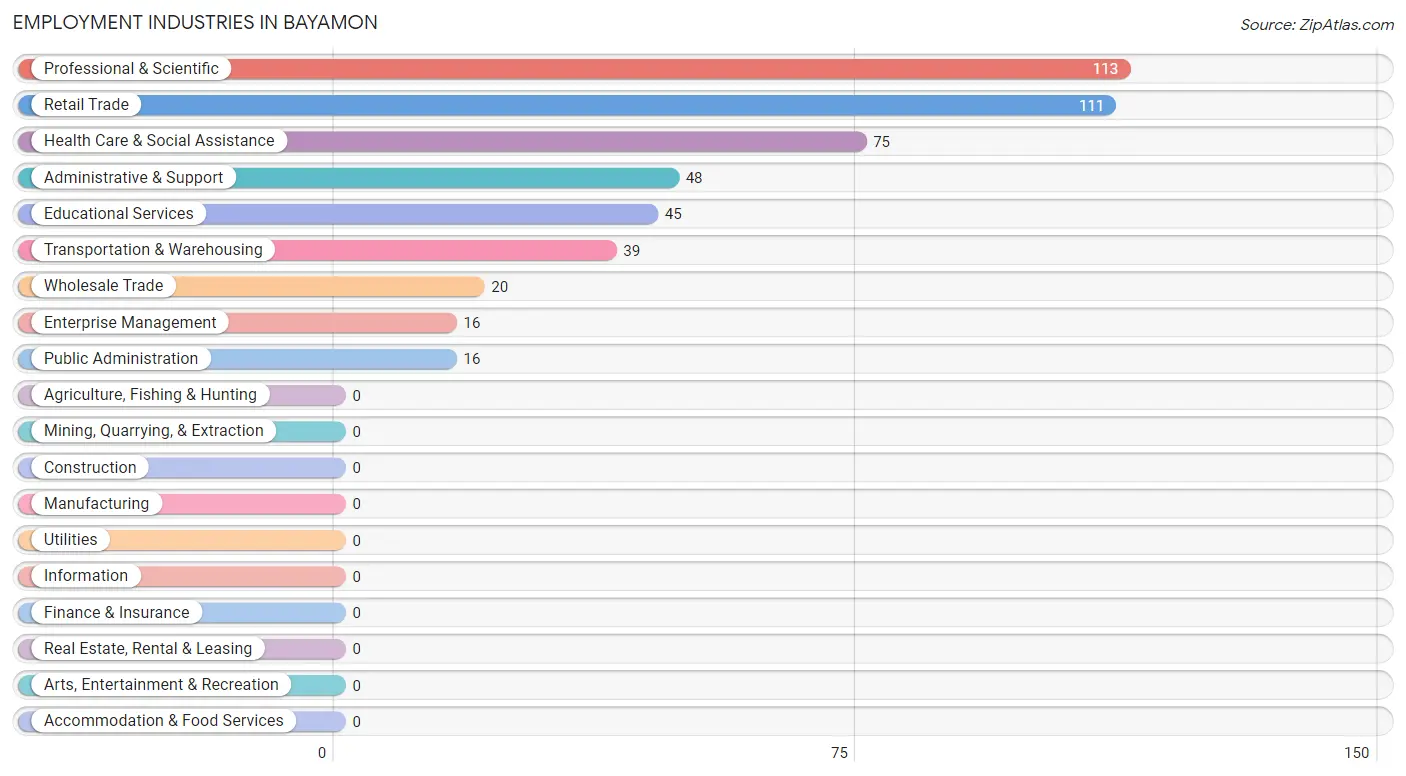
The major employment industries in Bayamon include Professional & Scientific (113 | 22.6%), Retail Trade (111 | 22.2%), Health Care & Social Assistance (75 | 15.0%), Administrative & Support (48 | 9.6%), and Educational Services (45 | 9.0%).
Employment Industries by Sex in Bayamon
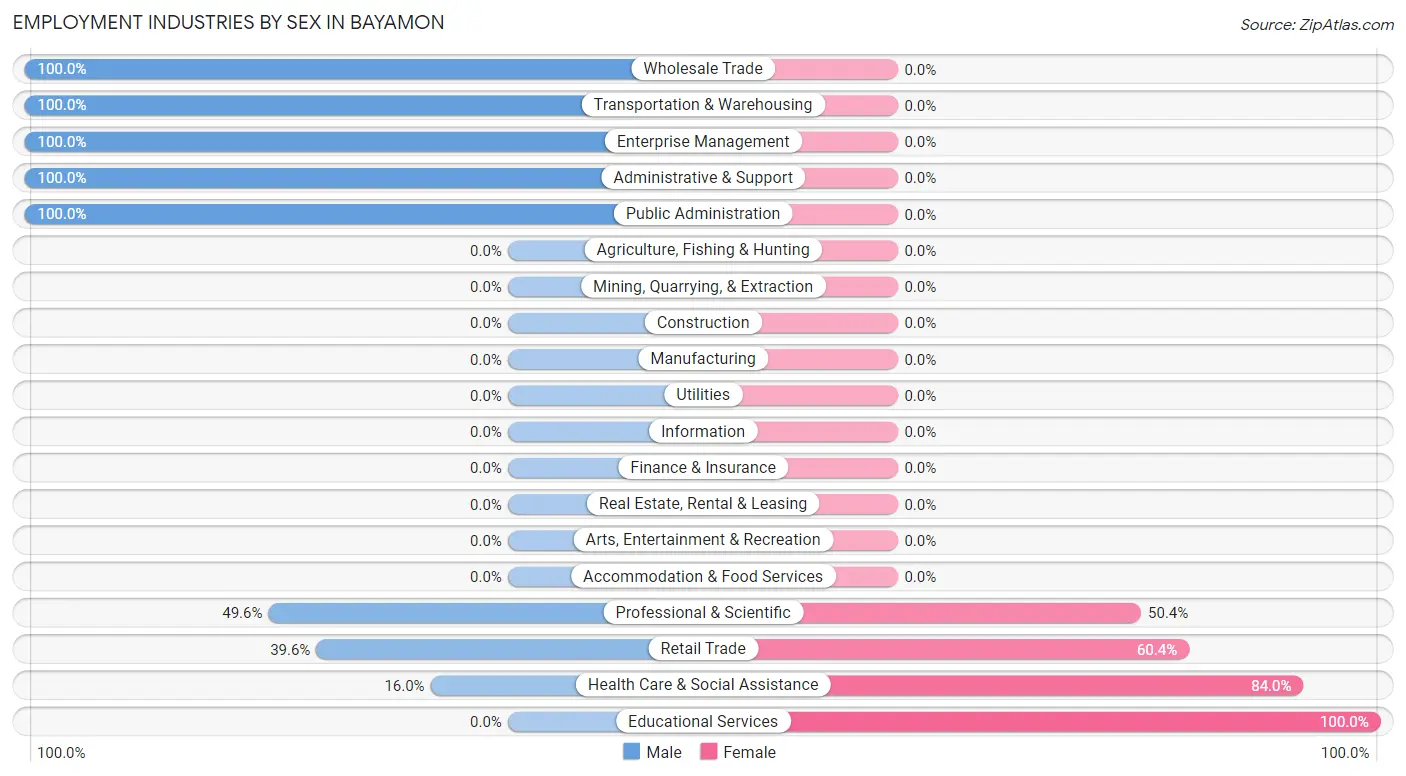
The Bayamon industries that see more men than women are Wholesale Trade (100.0%), Transportation & Warehousing (100.0%), and Enterprise Management (100.0%), whereas the industries that tend to have a higher number of women are Educational Services (100.0%), Health Care & Social Assistance (84.0%), and Retail Trade (60.4%).
| Industry | Male | Female |
| Agriculture, Fishing & Hunting | 0 (0.0%) | 0 (0.0%) |
| Mining, Quarrying, & Extraction | 0 (0.0%) | 0 (0.0%) |
| Construction | 0 (0.0%) | 0 (0.0%) |
| Manufacturing | 0 (0.0%) | 0 (0.0%) |
| Wholesale Trade | 20 (100.0%) | 0 (0.0%) |
| Retail Trade | 44 (39.6%) | 67 (60.4%) |
| Transportation & Warehousing | 39 (100.0%) | 0 (0.0%) |
| Utilities | 0 (0.0%) | 0 (0.0%) |
| Information | 0 (0.0%) | 0 (0.0%) |
| Finance & Insurance | 0 (0.0%) | 0 (0.0%) |
| Real Estate, Rental & Leasing | 0 (0.0%) | 0 (0.0%) |
| Professional & Scientific | 56 (49.6%) | 57 (50.4%) |
| Enterprise Management | 16 (100.0%) | 0 (0.0%) |
| Administrative & Support | 48 (100.0%) | 0 (0.0%) |
| Educational Services | 0 (0.0%) | 45 (100.0%) |
| Health Care & Social Assistance | 12 (16.0%) | 63 (84.0%) |
| Arts, Entertainment & Recreation | 0 (0.0%) | 0 (0.0%) |
| Accommodation & Food Services | 0 (0.0%) | 0 (0.0%) |
| Public Administration | 16 (100.0%) | 0 (0.0%) |
| Total | 268 (53.6%) | 232 (46.4%) |
Education in Bayamon
School Enrollment in Bayamon
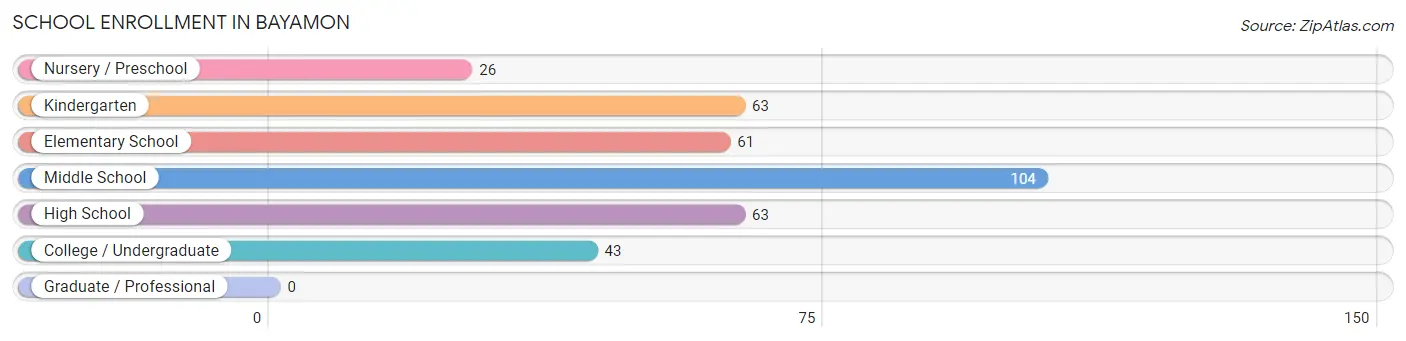
The most common levels of schooling among the 360 students in Bayamon are middle school (104 | 28.9%), kindergarten (63 | 17.5%), and high school (63 | 17.5%).
| School Level | # Students | % Students |
| Nursery / Preschool | 26 | 7.2% |
| Kindergarten | 63 | 17.5% |
| Elementary School | 61 | 16.9% |
| Middle School | 104 | 28.9% |
| High School | 63 | 17.5% |
| College / Undergraduate | 43 | 11.9% |
| Graduate / Professional | 0 | 0.0% |
| Total | 360 | 100.0% |
School Enrollment by Age by Funding Source in Bayamon
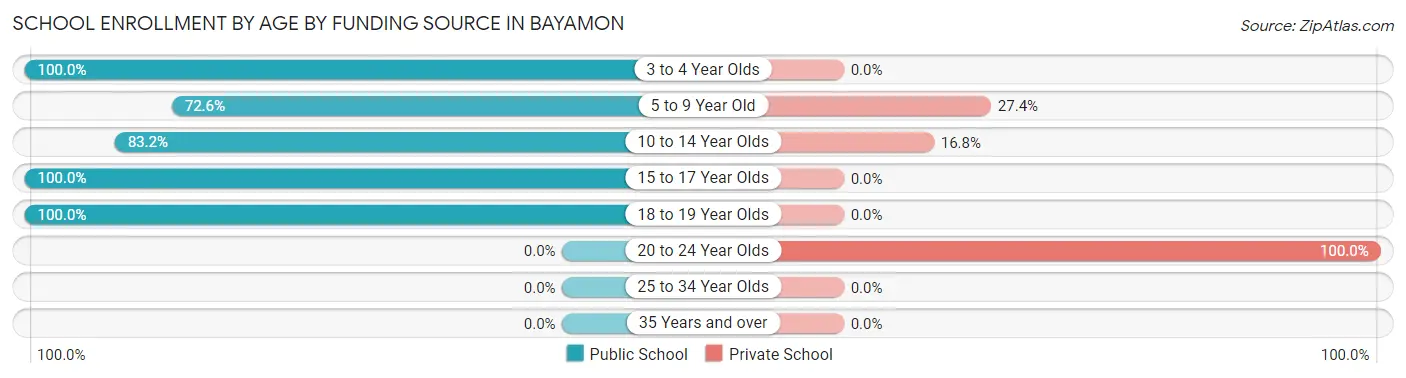
Out of a total of 360 students who are enrolled in schools in Bayamon, 82 (22.8%) attend a private institution, while the remaining 278 (77.2%) are enrolled in public schools. The age group of 20 to 24 year olds has the highest likelihood of being enrolled in private schools, with 26 (100.0% in the age bracket) enrolled. Conversely, the age group of 3 to 4 year olds has the lowest likelihood of being enrolled in a private school, with 26 (100.0% in the age bracket) attending a public institution.
| Age Bracket | Public School | Private School |
| 3 to 4 Year Olds | 26 (100.0%) | 0 (0.0%) |
| 5 to 9 Year Old | 90 (72.6%) | 34 (27.4%) |
| 10 to 14 Year Olds | 109 (83.2%) | 22 (16.8%) |
| 15 to 17 Year Olds | 36 (100.0%) | 0 (0.0%) |
| 18 to 19 Year Olds | 17 (100.0%) | 0 (0.0%) |
| 20 to 24 Year Olds | 0 (0.0%) | 26 (100.0%) |
| 25 to 34 Year Olds | 0 (0.0%) | 0 (0.0%) |
| 35 Years and over | 0 (0.0%) | 0 (0.0%) |
| Total | 278 (77.2%) | 82 (22.8%) |
Educational Attainment by Field of Study in Bayamon
Education (72 | 18.3%), psychology (61 | 15.5%), engineering (59 | 15.0%), literature & languages (57 | 14.5%), and visual & performing arts (36 | 9.2%) are the most common fields of study among 393 individuals in Bayamon who have obtained a bachelor's degree or higher.
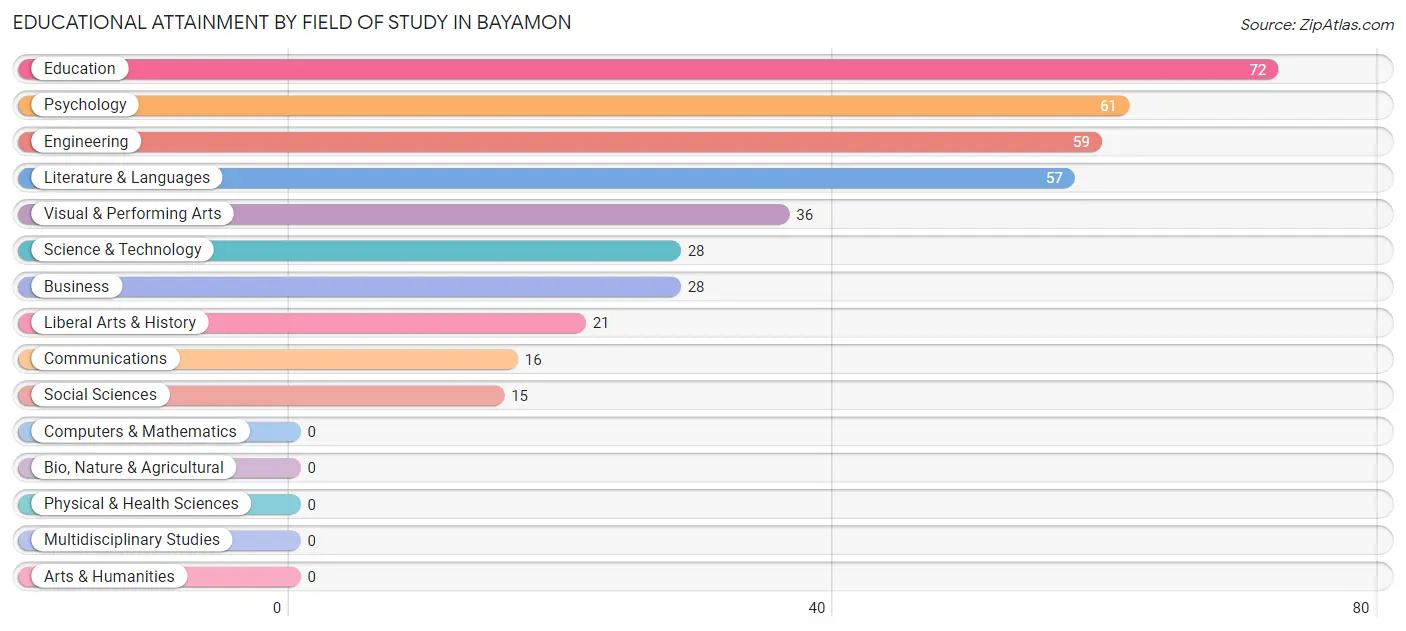
| Field of Study | # Graduates | % Graduates |
| Computers & Mathematics | 0 | 0.0% |
| Bio, Nature & Agricultural | 0 | 0.0% |
| Physical & Health Sciences | 0 | 0.0% |
| Psychology | 61 | 15.5% |
| Social Sciences | 15 | 3.8% |
| Engineering | 59 | 15.0% |
| Multidisciplinary Studies | 0 | 0.0% |
| Science & Technology | 28 | 7.1% |
| Business | 28 | 7.1% |
| Education | 72 | 18.3% |
| Literature & Languages | 57 | 14.5% |
| Liberal Arts & History | 21 | 5.3% |
| Visual & Performing Arts | 36 | 9.2% |
| Communications | 16 | 4.1% |
| Arts & Humanities | 0 | 0.0% |
| Total | 393 | 100.0% |
Transportation & Commute in Bayamon
Vehicle Availability by Sex in Bayamon
The most prevalent vehicle ownership categories in Bayamon are males with 2 vehicles (130, accounting for 48.5%) and females with 2 vehicles (120, making up 56.0%).
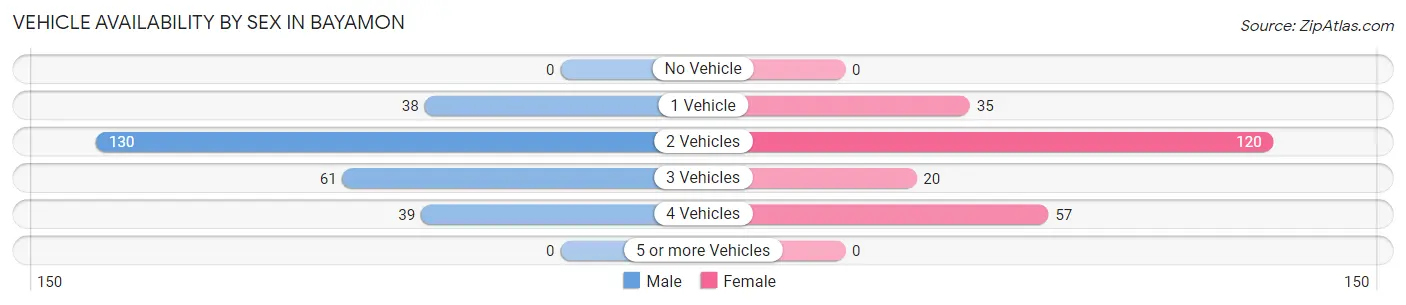
| Vehicles Available | Male | Female |
| No Vehicle | 0 (0.0%) | 0 (0.0%) |
| 1 Vehicle | 38 (14.2%) | 35 (15.1%) |
| 2 Vehicles | 130 (48.5%) | 120 (51.7%) |
| 3 Vehicles | 61 (22.8%) | 20 (8.6%) |
| 4 Vehicles | 39 (14.5%) | 57 (24.6%) |
| 5 or more Vehicles | 0 (0.0%) | 0 (0.0%) |
| Total | 268 (100.0%) | 232 (100.0%) |
Commute Time in Bayamon
The most frequently occuring commute durations in Bayamon are 30 to 34 minutes (170 commuters, 34.0%), 20 to 24 minutes (91 commuters, 18.2%), and 60 to 89 minutes (59 commuters, 11.8%).
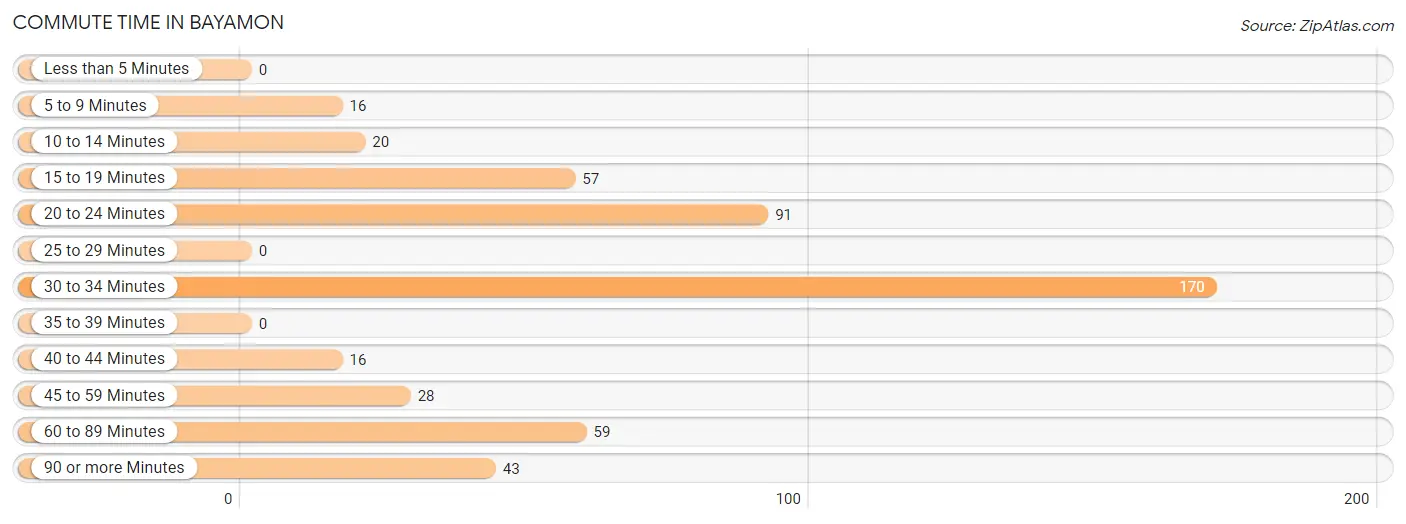
| Commute Time | # Commuters | % Commuters |
| Less than 5 Minutes | 0 | 0.0% |
| 5 to 9 Minutes | 16 | 3.2% |
| 10 to 14 Minutes | 20 | 4.0% |
| 15 to 19 Minutes | 57 | 11.4% |
| 20 to 24 Minutes | 91 | 18.2% |
| 25 to 29 Minutes | 0 | 0.0% |
| 30 to 34 Minutes | 170 | 34.0% |
| 35 to 39 Minutes | 0 | 0.0% |
| 40 to 44 Minutes | 16 | 3.2% |
| 45 to 59 Minutes | 28 | 5.6% |
| 60 to 89 Minutes | 59 | 11.8% |
| 90 or more Minutes | 43 | 8.6% |
Commute Time by Sex in Bayamon
The most common commute times in Bayamon are 30 to 34 minutes (60 commuters, 22.4%) for males and 30 to 34 minutes (110 commuters, 47.4%) for females.
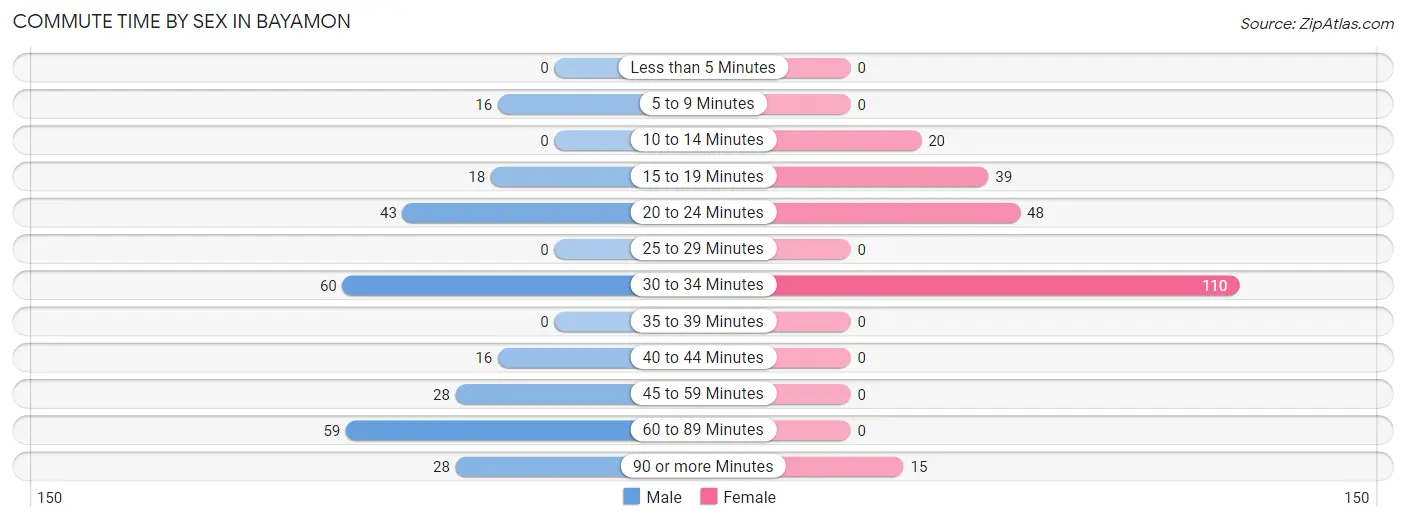
| Commute Time | Male | Female |
| Less than 5 Minutes | 0 (0.0%) | 0 (0.0%) |
| 5 to 9 Minutes | 16 (6.0%) | 0 (0.0%) |
| 10 to 14 Minutes | 0 (0.0%) | 20 (8.6%) |
| 15 to 19 Minutes | 18 (6.7%) | 39 (16.8%) |
| 20 to 24 Minutes | 43 (16.0%) | 48 (20.7%) |
| 25 to 29 Minutes | 0 (0.0%) | 0 (0.0%) |
| 30 to 34 Minutes | 60 (22.4%) | 110 (47.4%) |
| 35 to 39 Minutes | 0 (0.0%) | 0 (0.0%) |
| 40 to 44 Minutes | 16 (6.0%) | 0 (0.0%) |
| 45 to 59 Minutes | 28 (10.4%) | 0 (0.0%) |
| 60 to 89 Minutes | 59 (22.0%) | 0 (0.0%) |
| 90 or more Minutes | 28 (10.4%) | 15 (6.5%) |
Time of Departure to Work by Sex in Bayamon
The most frequent times of departure to work in Bayamon are 7:00 AM to 7:29 AM (128, 47.8%) for males and 6:30 AM to 6:59 AM (100, 43.1%) for females.
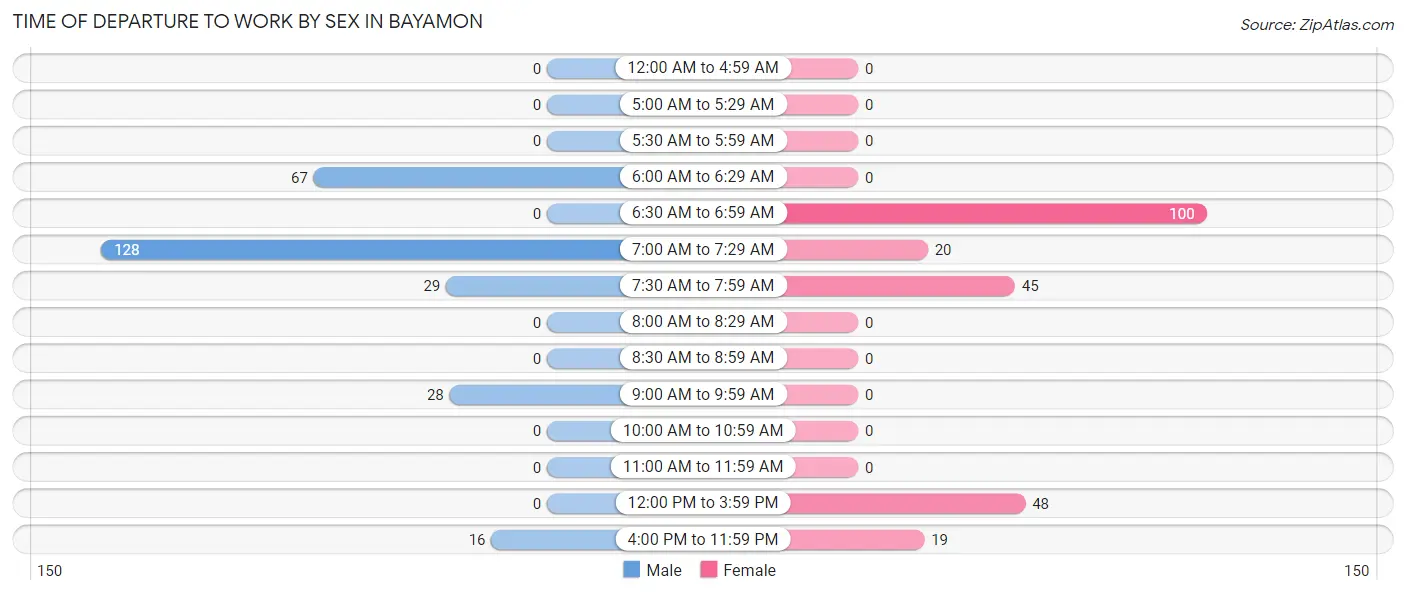
| Time of Departure | Male | Female |
| 12:00 AM to 4:59 AM | 0 (0.0%) | 0 (0.0%) |
| 5:00 AM to 5:29 AM | 0 (0.0%) | 0 (0.0%) |
| 5:30 AM to 5:59 AM | 0 (0.0%) | 0 (0.0%) |
| 6:00 AM to 6:29 AM | 67 (25.0%) | 0 (0.0%) |
| 6:30 AM to 6:59 AM | 0 (0.0%) | 100 (43.1%) |
| 7:00 AM to 7:29 AM | 128 (47.8%) | 20 (8.6%) |
| 7:30 AM to 7:59 AM | 29 (10.8%) | 45 (19.4%) |
| 8:00 AM to 8:29 AM | 0 (0.0%) | 0 (0.0%) |
| 8:30 AM to 8:59 AM | 0 (0.0%) | 0 (0.0%) |
| 9:00 AM to 9:59 AM | 28 (10.4%) | 0 (0.0%) |
| 10:00 AM to 10:59 AM | 0 (0.0%) | 0 (0.0%) |
| 11:00 AM to 11:59 AM | 0 (0.0%) | 0 (0.0%) |
| 12:00 PM to 3:59 PM | 0 (0.0%) | 48 (20.7%) |
| 4:00 PM to 11:59 PM | 16 (6.0%) | 19 (8.2%) |
| Total | 268 (100.0%) | 232 (100.0%) |
Housing Occupancy in Bayamon
Occupancy by Ownership in Bayamon
Of the total 623 dwellings in Bayamon, owner-occupied units account for 409 (65.6%), while renter-occupied units make up 214 (34.4%).
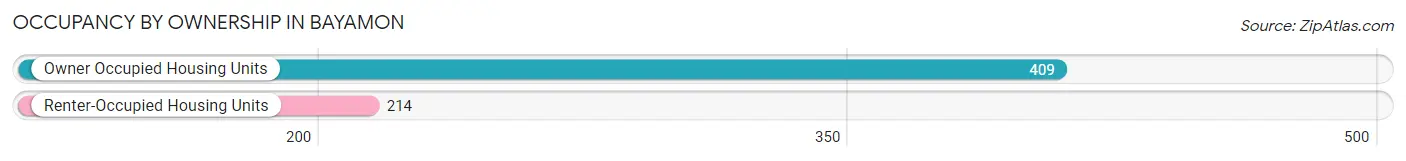
| Occupancy | # Housing Units | % Housing Units |
| Owner Occupied Housing Units | 409 | 65.6% |
| Renter-Occupied Housing Units | 214 | 34.4% |
| Total Occupied Housing Units | 623 | 100.0% |
Occupancy by Household Size in Bayamon
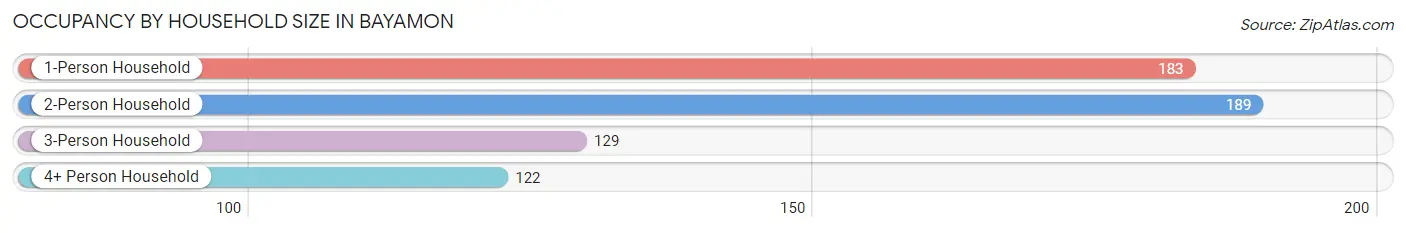
| Household Size | # Housing Units | % Housing Units |
| 1-Person Household | 183 | 29.4% |
| 2-Person Household | 189 | 30.3% |
| 3-Person Household | 129 | 20.7% |
| 4+ Person Household | 122 | 19.6% |
| Total Housing Units | 623 | 100.0% |
Occupancy by Ownership by Household Size in Bayamon
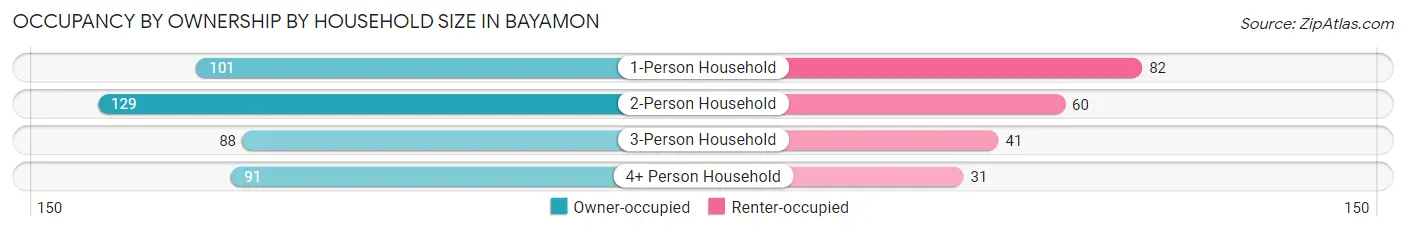
| Household Size | Owner-occupied | Renter-occupied |
| 1-Person Household | 101 (55.2%) | 82 (44.8%) |
| 2-Person Household | 129 (68.2%) | 60 (31.8%) |
| 3-Person Household | 88 (68.2%) | 41 (31.8%) |
| 4+ Person Household | 91 (74.6%) | 31 (25.4%) |
| Total Housing Units | 409 (65.6%) | 214 (34.4%) |
Occupancy by Educational Attainment in Bayamon
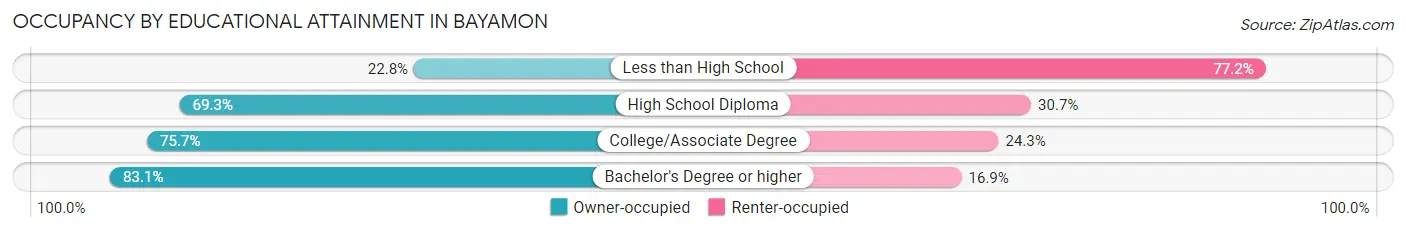
| Household Size | Owner-occupied | Renter-occupied |
| Less than High School | 26 (22.8%) | 88 (77.2%) |
| High School Diploma | 124 (69.3%) | 55 (30.7%) |
| College/Associate Degree | 156 (75.7%) | 50 (24.3%) |
| Bachelor's Degree or higher | 103 (83.1%) | 21 (16.9%) |
Occupancy by Age of Householder in Bayamon
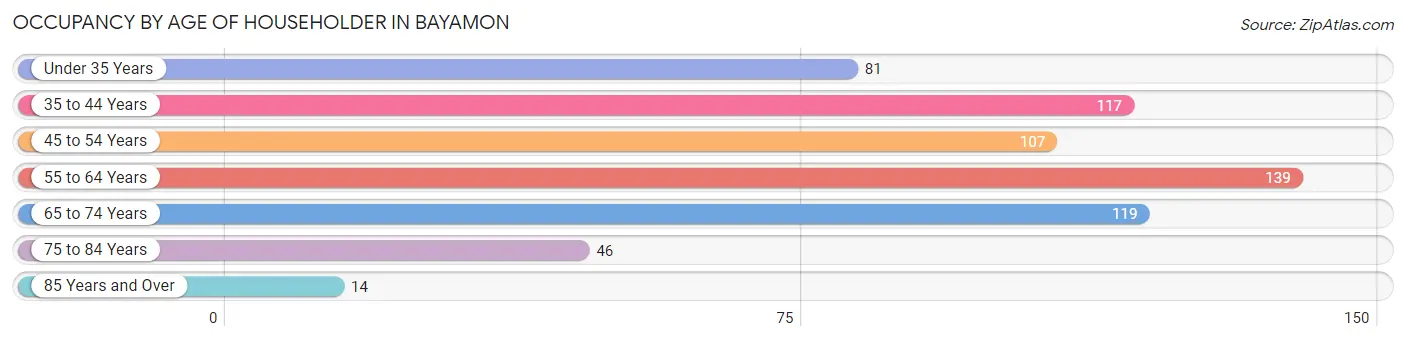
| Age Bracket | # Households | % Households |
| Under 35 Years | 81 | 13.0% |
| 35 to 44 Years | 117 | 18.8% |
| 45 to 54 Years | 107 | 17.2% |
| 55 to 64 Years | 139 | 22.3% |
| 65 to 74 Years | 119 | 19.1% |
| 75 to 84 Years | 46 | 7.4% |
| 85 Years and Over | 14 | 2.2% |
| Total | 623 | 100.0% |
Housing Finances in Bayamon
Median Income by Occupancy in Bayamon
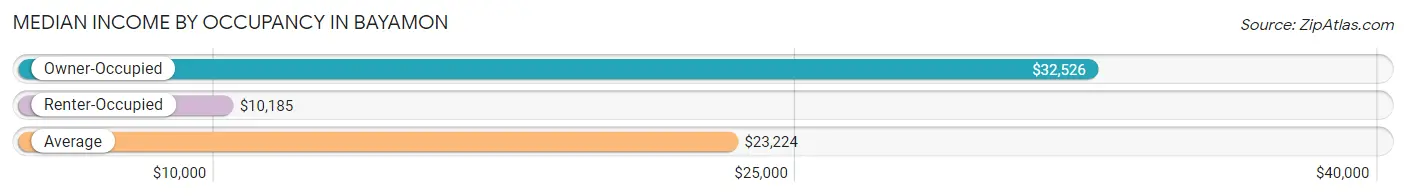
| Occupancy Type | # Households | Median Income |
| Owner-Occupied | 409 (65.6%) | $32,526 |
| Renter-Occupied | 214 (34.4%) | $10,185 |
| Average | 623 (100.0%) | $23,224 |
Occupancy by Householder Income Bracket in Bayamon
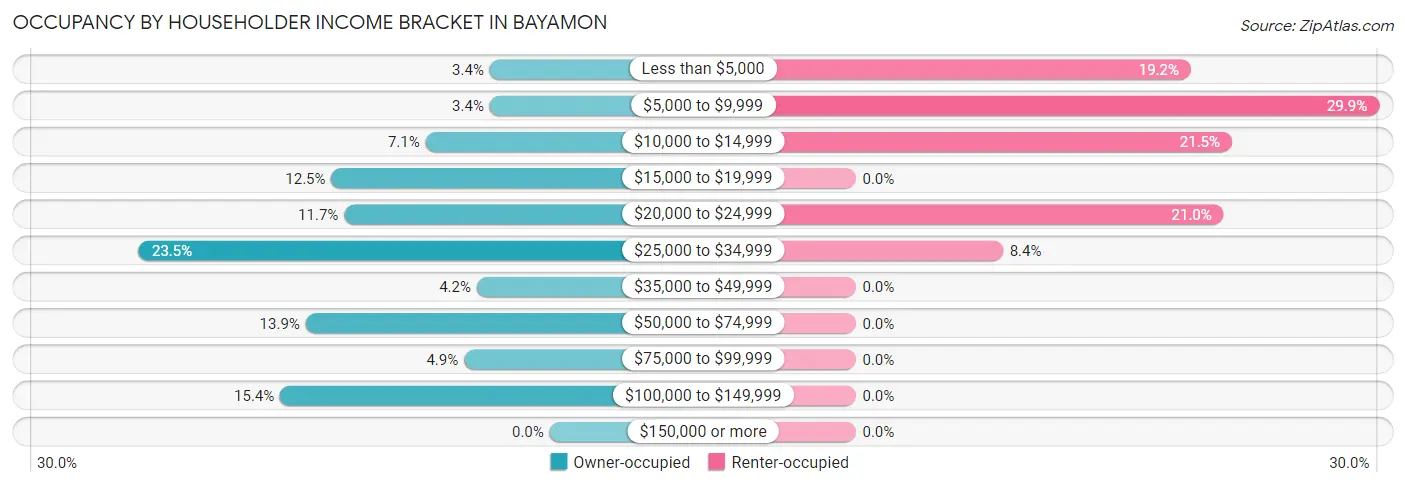
| Income Bracket | Owner-occupied | Renter-occupied |
| Less than $5,000 | 14 (3.4%) | 41 (19.2%) |
| $5,000 to $9,999 | 14 (3.4%) | 64 (29.9%) |
| $10,000 to $14,999 | 29 (7.1%) | 46 (21.5%) |
| $15,000 to $19,999 | 51 (12.5%) | 0 (0.0%) |
| $20,000 to $24,999 | 48 (11.7%) | 45 (21.0%) |
| $25,000 to $34,999 | 96 (23.5%) | 18 (8.4%) |
| $35,000 to $49,999 | 17 (4.2%) | 0 (0.0%) |
| $50,000 to $74,999 | 57 (13.9%) | 0 (0.0%) |
| $75,000 to $99,999 | 20 (4.9%) | 0 (0.0%) |
| $100,000 to $149,999 | 63 (15.4%) | 0 (0.0%) |
| $150,000 or more | 0 (0.0%) | 0 (0.0%) |
| Total | 409 (100.0%) | 214 (100.0%) |
Monthly Housing Cost Tiers in Bayamon
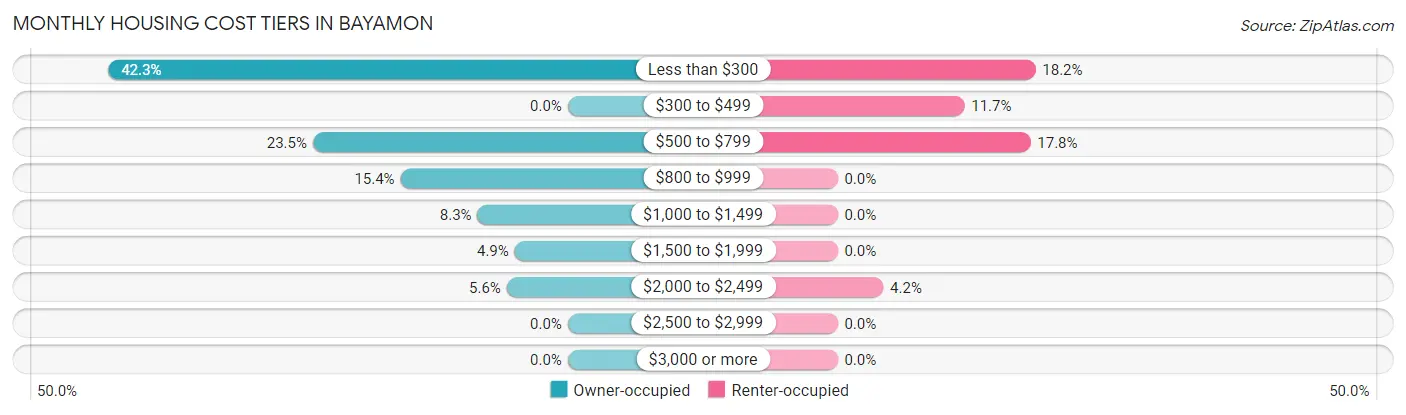
| Monthly Cost | Owner-occupied | Renter-occupied |
| Less than $300 | 173 (42.3%) | 39 (18.2%) |
| $300 to $499 | 0 (0.0%) | 25 (11.7%) |
| $500 to $799 | 96 (23.5%) | 38 (17.8%) |
| $800 to $999 | 63 (15.4%) | 0 (0.0%) |
| $1,000 to $1,499 | 34 (8.3%) | 0 (0.0%) |
| $1,500 to $1,999 | 20 (4.9%) | 0 (0.0%) |
| $2,000 to $2,499 | 23 (5.6%) | 9 (4.2%) |
| $2,500 to $2,999 | 0 (0.0%) | 0 (0.0%) |
| $3,000 or more | 0 (0.0%) | 0 (0.0%) |
| Total | 409 (100.0%) | 214 (100.0%) |
Physical Housing Characteristics in Bayamon
Housing Structures in Bayamon
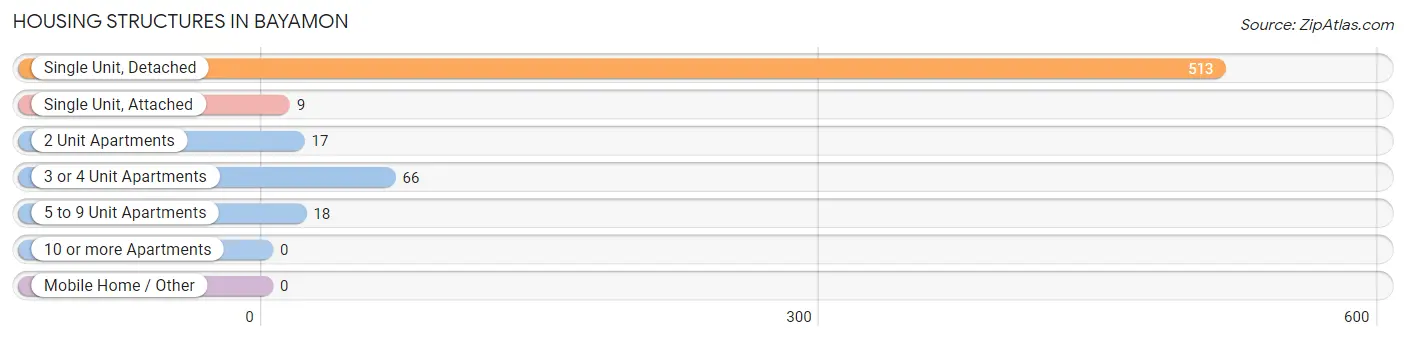
| Structure Type | # Housing Units | % Housing Units |
| Single Unit, Detached | 513 | 82.3% |
| Single Unit, Attached | 9 | 1.4% |
| 2 Unit Apartments | 17 | 2.7% |
| 3 or 4 Unit Apartments | 66 | 10.6% |
| 5 to 9 Unit Apartments | 18 | 2.9% |
| 10 or more Apartments | 0 | 0.0% |
| Mobile Home / Other | 0 | 0.0% |
| Total | 623 | 100.0% |
Housing Structures by Occupancy in Bayamon
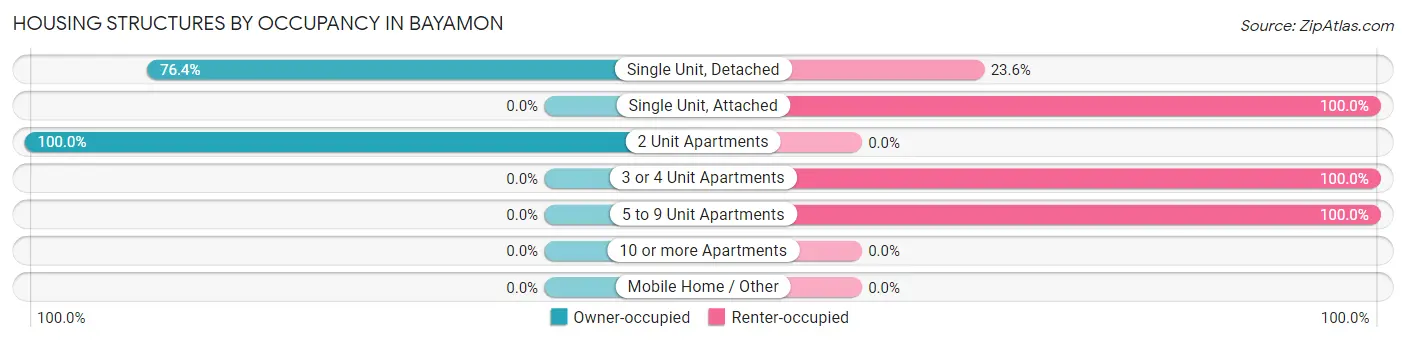
| Structure Type | Owner-occupied | Renter-occupied |
| Single Unit, Detached | 392 (76.4%) | 121 (23.6%) |
| Single Unit, Attached | 0 (0.0%) | 9 (100.0%) |
| 2 Unit Apartments | 17 (100.0%) | 0 (0.0%) |
| 3 or 4 Unit Apartments | 0 (0.0%) | 66 (100.0%) |
| 5 to 9 Unit Apartments | 0 (0.0%) | 18 (100.0%) |
| 10 or more Apartments | 0 (0.0%) | 0 (0.0%) |
| Mobile Home / Other | 0 (0.0%) | 0 (0.0%) |
| Total | 409 (65.6%) | 214 (34.4%) |
Housing Structures by Number of Rooms in Bayamon
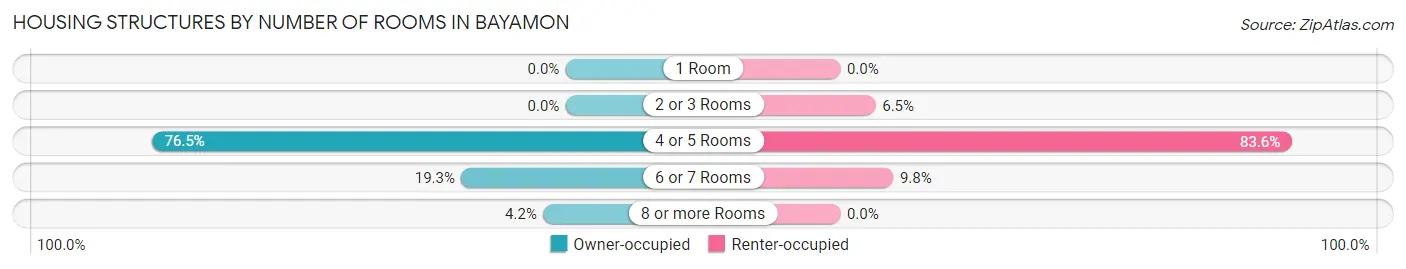
| Number of Rooms | Owner-occupied | Renter-occupied |
| 1 Room | 0 (0.0%) | 0 (0.0%) |
| 2 or 3 Rooms | 0 (0.0%) | 14 (6.5%) |
| 4 or 5 Rooms | 313 (76.5%) | 179 (83.6%) |
| 6 or 7 Rooms | 79 (19.3%) | 21 (9.8%) |
| 8 or more Rooms | 17 (4.2%) | 0 (0.0%) |
| Total | 409 (100.0%) | 214 (100.0%) |
Housing Structure by Heating Type in Bayamon
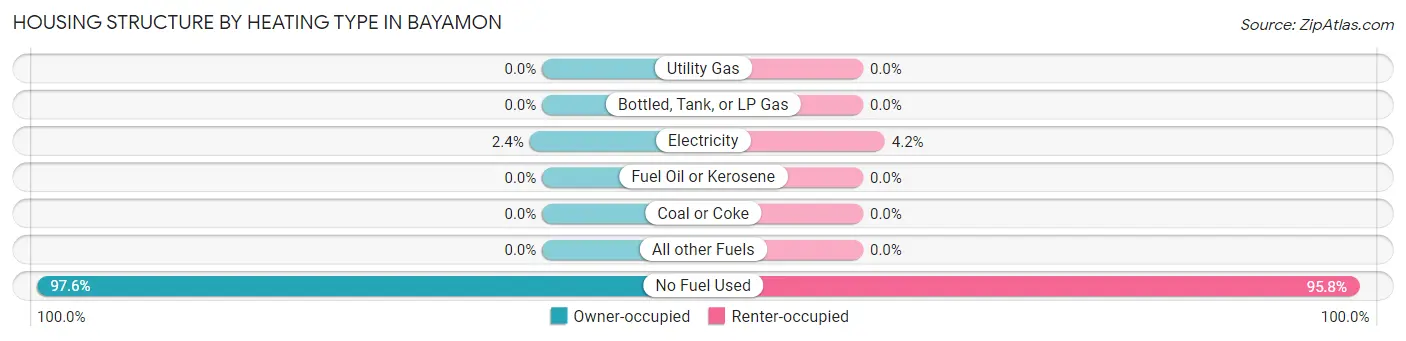
| Heating Type | Owner-occupied | Renter-occupied |
| Utility Gas | 0 (0.0%) | 0 (0.0%) |
| Bottled, Tank, or LP Gas | 0 (0.0%) | 0 (0.0%) |
| Electricity | 10 (2.4%) | 9 (4.2%) |
| Fuel Oil or Kerosene | 0 (0.0%) | 0 (0.0%) |
| Coal or Coke | 0 (0.0%) | 0 (0.0%) |
| All other Fuels | 0 (0.0%) | 0 (0.0%) |
| No Fuel Used | 399 (97.6%) | 205 (95.8%) |
| Total | 409 (100.0%) | 214 (100.0%) |
Household Vehicle Usage in Bayamon
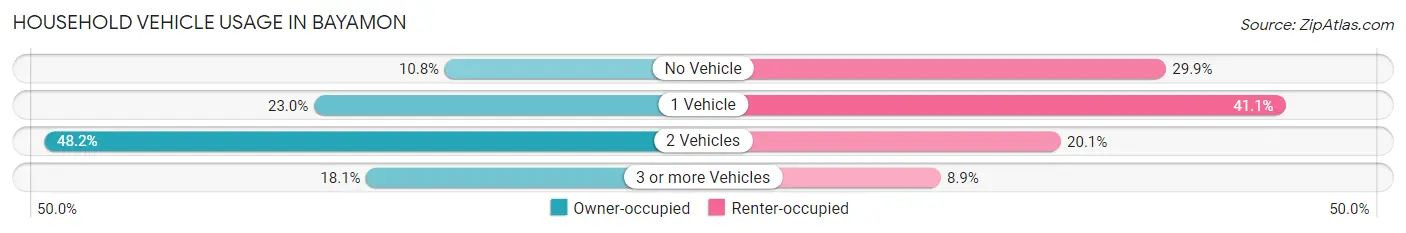
| Vehicles per Household | Owner-occupied | Renter-occupied |
| No Vehicle | 44 (10.8%) | 64 (29.9%) |
| 1 Vehicle | 94 (23.0%) | 88 (41.1%) |
| 2 Vehicles | 197 (48.2%) | 43 (20.1%) |
| 3 or more Vehicles | 74 (18.1%) | 19 (8.9%) |
| Total | 409 (100.0%) | 214 (100.0%) |
Real Estate & Mortgages in Bayamon
Real Estate and Mortgage Overview in Bayamon
| Characteristic | Without Mortgage | With Mortgage |
| Housing Units | 173 | 236 |
| Median Property Value | $82,200 | $145,000 |
| Median Household Income | $16,446 | $0 |
| Monthly Housing Costs | $120 | $0 |
| Real Estate Taxes | - | - |
Property Value by Mortgage Status in Bayamon
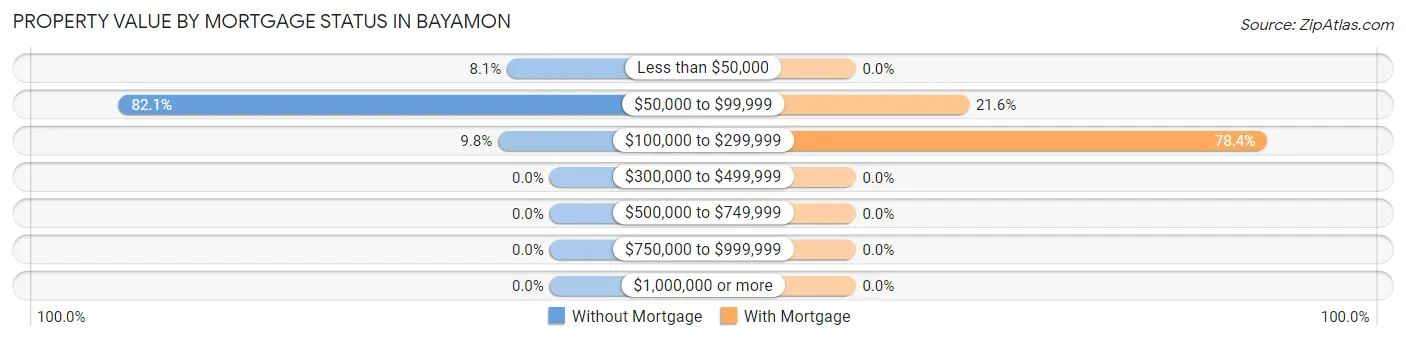
| Property Value | Without Mortgage | With Mortgage |
| Less than $50,000 | 14 (8.1%) | 0 (0.0%) |
| $50,000 to $99,999 | 142 (82.1%) | 51 (21.6%) |
| $100,000 to $299,999 | 17 (9.8%) | 185 (78.4%) |
| $300,000 to $499,999 | 0 (0.0%) | 0 (0.0%) |
| $500,000 to $749,999 | 0 (0.0%) | 0 (0.0%) |
| $750,000 to $999,999 | 0 (0.0%) | 0 (0.0%) |
| $1,000,000 or more | 0 (0.0%) | 0 (0.0%) |
| Total | 173 (100.0%) | 236 (100.0%) |
Household Income by Mortgage Status in Bayamon
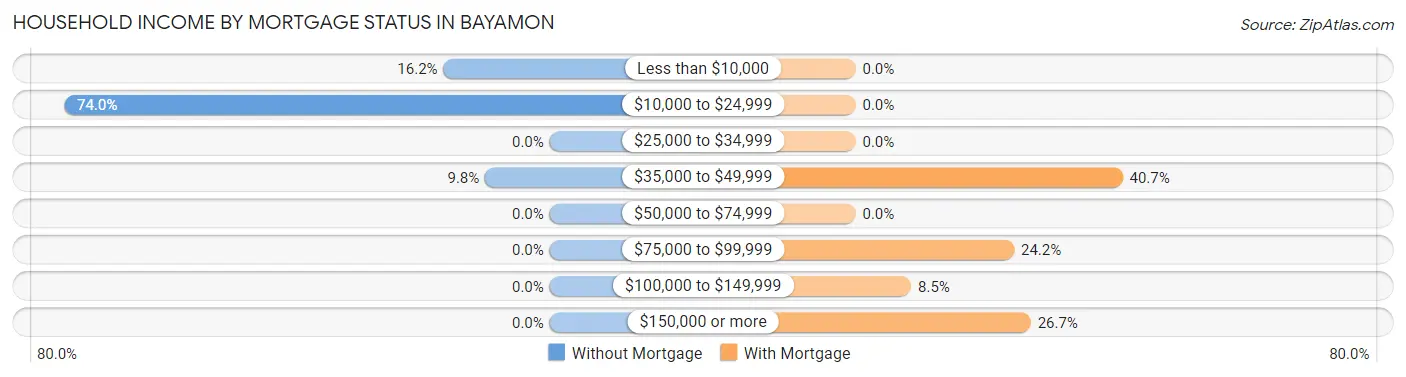
| Household Income | Without Mortgage | With Mortgage |
| Less than $10,000 | 28 (16.2%) | 0 (0.0%) |
| $10,000 to $24,999 | 128 (74.0%) | 0 (0.0%) |
| $25,000 to $34,999 | 0 (0.0%) | 0 (0.0%) |
| $35,000 to $49,999 | 17 (9.8%) | 96 (40.7%) |
| $50,000 to $74,999 | 0 (0.0%) | 0 (0.0%) |
| $75,000 to $99,999 | 0 (0.0%) | 57 (24.1%) |
| $100,000 to $149,999 | 0 (0.0%) | 20 (8.5%) |
| $150,000 or more | 0 (0.0%) | 63 (26.7%) |
| Total | 173 (100.0%) | 236 (100.0%) |
Property Value to Household Income Ratio in Bayamon
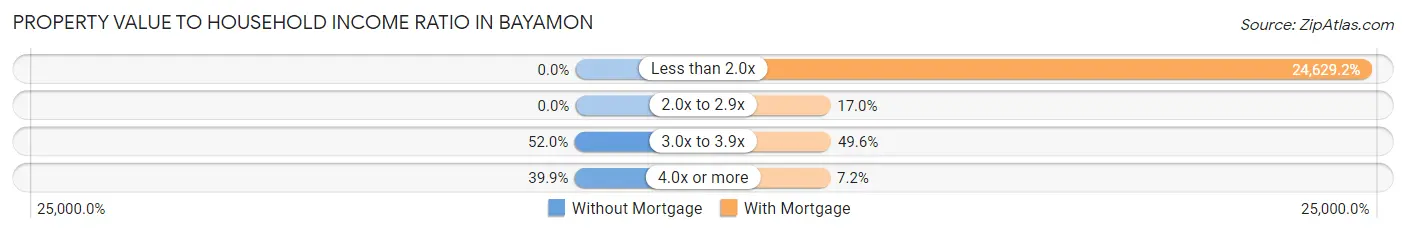
| Value-to-Income Ratio | Without Mortgage | With Mortgage |
| Less than 2.0x | 0 (0.0%) | 58,125 (24,629.2%) |
| 2.0x to 2.9x | 0 (0.0%) | 40 (17.0%) |
| 3.0x to 3.9x | 90 (52.0%) | 117 (49.6%) |
| 4.0x or more | 69 (39.9%) | 17 (7.2%) |
| Total | 173 (100.0%) | 236 (100.0%) |
Real Estate Taxes by Mortgage Status in Bayamon
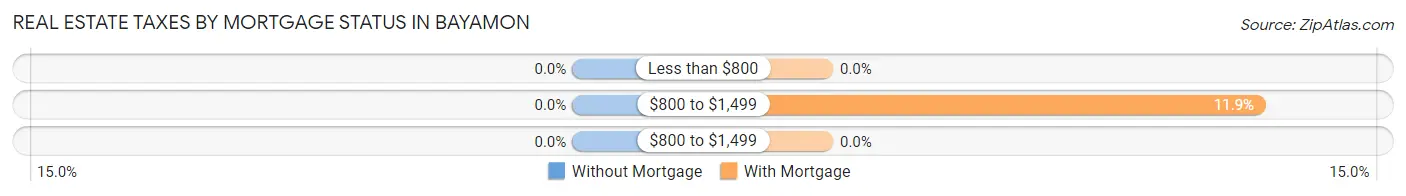
| Property Taxes | Without Mortgage | With Mortgage |
| Less than $800 | 0 (0.0%) | 0 (0.0%) |
| $800 to $1,499 | 0 (0.0%) | 28 (11.9%) |
| $800 to $1,499 | 0 (0.0%) | 0 (0.0%) |
| Total | 173 (100.0%) | 236 (100.0%) |
Health & Disability in Bayamon
Health Insurance Coverage by Age in Bayamon
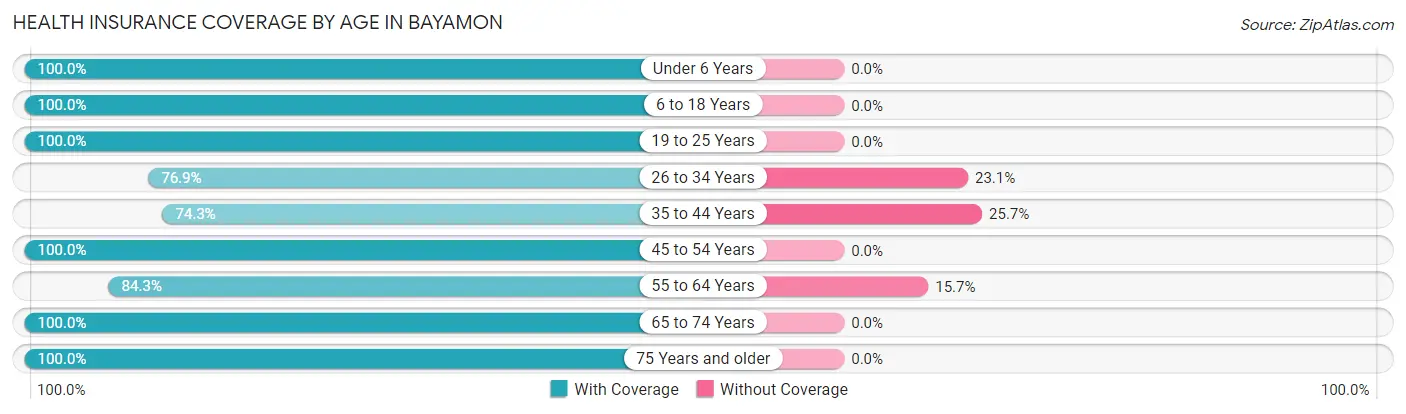
| Age Bracket | With Coverage | Without Coverage |
| Under 6 Years | 148 (100.0%) | 0 (0.0%) |
| 6 to 18 Years | 228 (100.0%) | 0 (0.0%) |
| 19 to 25 Years | 126 (100.0%) | 0 (0.0%) |
| 26 to 34 Years | 220 (76.9%) | 66 (23.1%) |
| 35 to 44 Years | 159 (74.3%) | 55 (25.7%) |
| 45 to 54 Years | 193 (100.0%) | 0 (0.0%) |
| 55 to 64 Years | 167 (84.3%) | 31 (15.7%) |
| 65 to 74 Years | 160 (100.0%) | 0 (0.0%) |
| 75 Years and older | 101 (100.0%) | 0 (0.0%) |
| Total | 1,502 (90.8%) | 152 (9.2%) |
Health Insurance Coverage by Citizenship Status in Bayamon
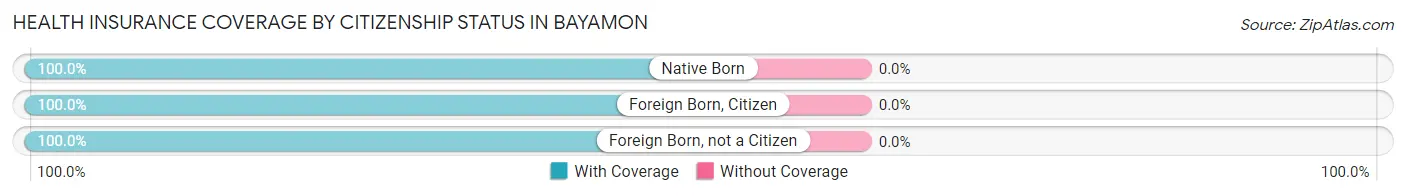
| Citizenship Status | With Coverage | Without Coverage |
| Native Born | 148 (100.0%) | 0 (0.0%) |
| Foreign Born, Citizen | 228 (100.0%) | 0 (0.0%) |
| Foreign Born, not a Citizen | 126 (100.0%) | 0 (0.0%) |
Health Insurance Coverage by Household Income in Bayamon
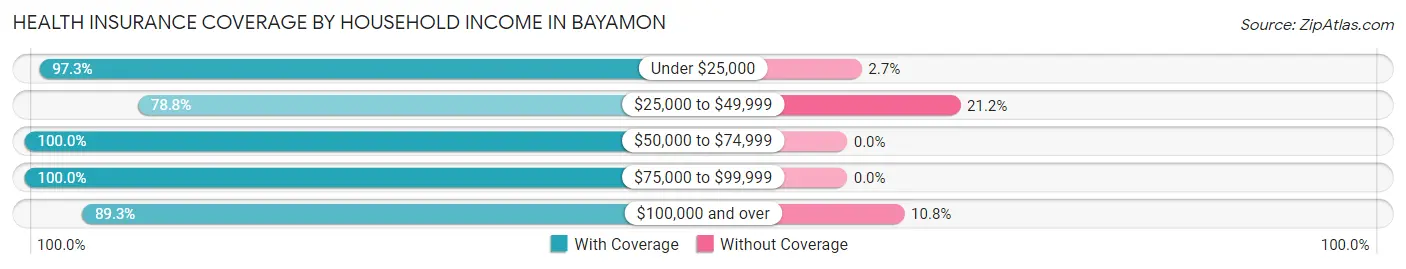
| Household Income | With Coverage | Without Coverage |
| Under $25,000 | 675 (97.3%) | 19 (2.7%) |
| $25,000 to $49,999 | 360 (78.8%) | 97 (21.2%) |
| $50,000 to $74,999 | 110 (100.0%) | 0 (0.0%) |
| $75,000 to $99,999 | 58 (100.0%) | 0 (0.0%) |
| $100,000 and over | 299 (89.2%) | 36 (10.7%) |
Public vs Private Health Insurance Coverage by Age in Bayamon
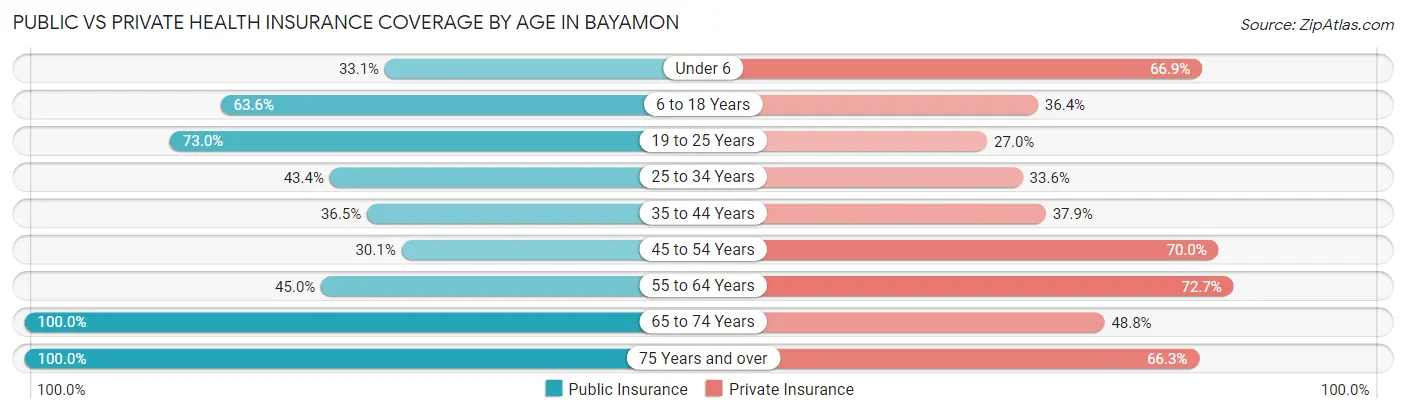
| Age Bracket | Public Insurance | Private Insurance |
| Under 6 | 49 (33.1%) | 99 (66.9%) |
| 6 to 18 Years | 145 (63.6%) | 83 (36.4%) |
| 19 to 25 Years | 92 (73.0%) | 34 (27.0%) |
| 25 to 34 Years | 124 (43.4%) | 96 (33.6%) |
| 35 to 44 Years | 78 (36.4%) | 81 (37.9%) |
| 45 to 54 Years | 58 (30.0%) | 135 (70.0%) |
| 55 to 64 Years | 89 (45.0%) | 144 (72.7%) |
| 65 to 74 Years | 160 (100.0%) | 78 (48.7%) |
| 75 Years and over | 101 (100.0%) | 67 (66.3%) |
| Total | 896 (54.2%) | 817 (49.4%) |
Disability Status by Sex by Age in Bayamon
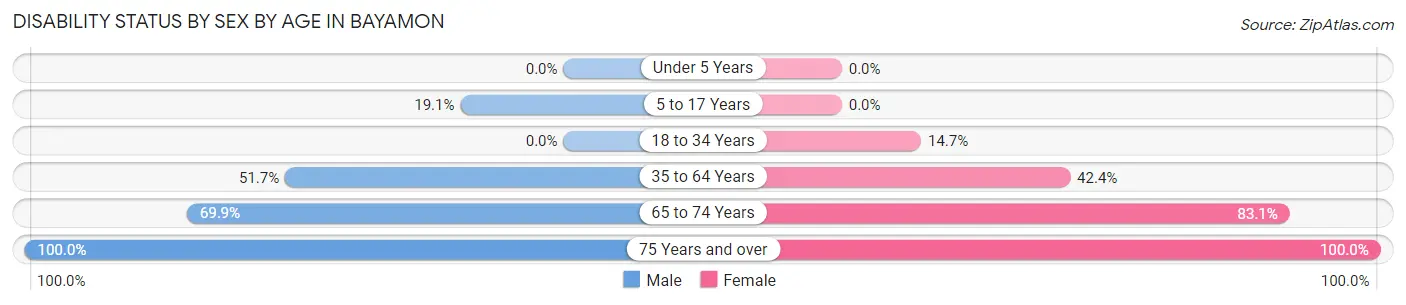
| Age Bracket | Male | Female |
| Under 5 Years | 0 (0.0%) | 0 (0.0%) |
| 5 to 17 Years | 22 (19.1%) | 0 (0.0%) |
| 18 to 34 Years | 0 (0.0%) | 25 (14.7%) |
| 35 to 64 Years | 109 (51.7%) | 167 (42.4%) |
| 65 to 74 Years | 58 (69.9%) | 64 (83.1%) |
| 75 Years and over | 13 (100.0%) | 88 (100.0%) |
Disability Class by Sex by Age in Bayamon
Disability Class: Hearing Difficulty
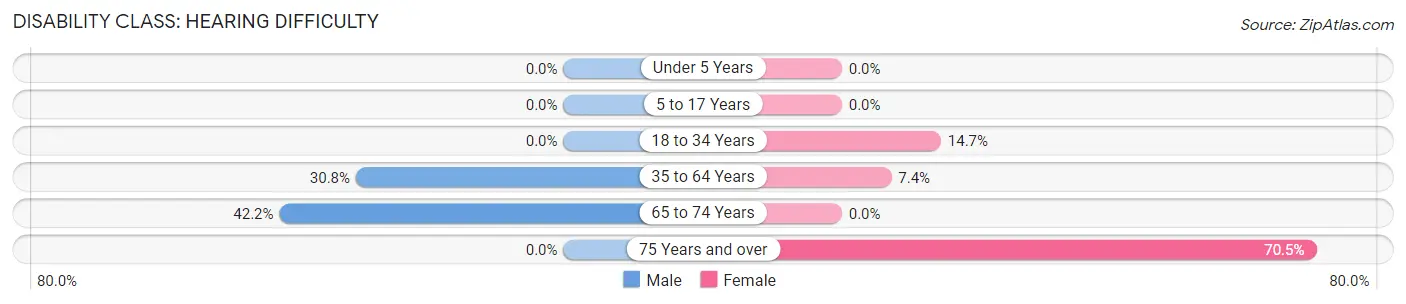
| Age Bracket | Male | Female |
| Under 5 Years | 0 (0.0%) | 0 (0.0%) |
| 5 to 17 Years | 0 (0.0%) | 0 (0.0%) |
| 18 to 34 Years | 0 (0.0%) | 25 (14.7%) |
| 35 to 64 Years | 65 (30.8%) | 29 (7.4%) |
| 65 to 74 Years | 35 (42.2%) | 0 (0.0%) |
| 75 Years and over | 0 (0.0%) | 62 (70.5%) |
Disability Class: Vision Difficulty
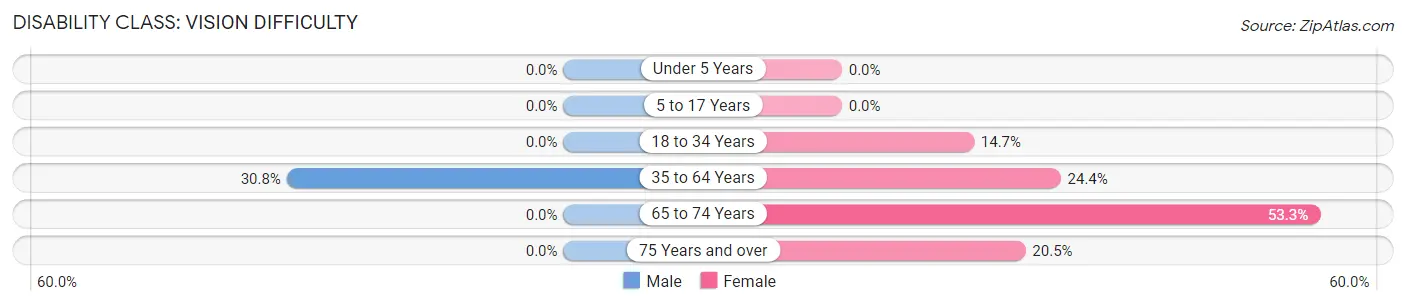
| Age Bracket | Male | Female |
| Under 5 Years | 0 (0.0%) | 0 (0.0%) |
| 5 to 17 Years | 0 (0.0%) | 0 (0.0%) |
| 18 to 34 Years | 0 (0.0%) | 25 (14.7%) |
| 35 to 64 Years | 65 (30.8%) | 96 (24.4%) |
| 65 to 74 Years | 0 (0.0%) | 41 (53.2%) |
| 75 Years and over | 0 (0.0%) | 18 (20.4%) |
Disability Class: Cognitive Difficulty
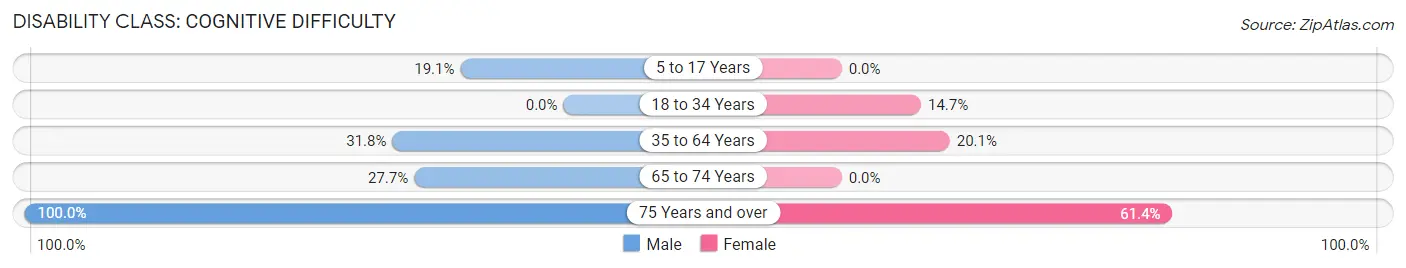
| Age Bracket | Male | Female |
| 5 to 17 Years | 22 (19.1%) | 0 (0.0%) |
| 18 to 34 Years | 0 (0.0%) | 25 (14.7%) |
| 35 to 64 Years | 67 (31.8%) | 79 (20.1%) |
| 65 to 74 Years | 23 (27.7%) | 0 (0.0%) |
| 75 Years and over | 13 (100.0%) | 54 (61.4%) |
Disability Class: Ambulatory Difficulty
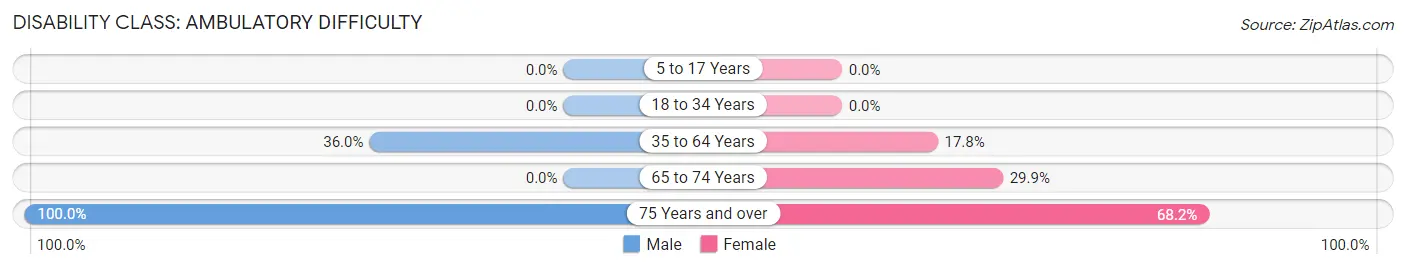
| Age Bracket | Male | Female |
| 5 to 17 Years | 0 (0.0%) | 0 (0.0%) |
| 18 to 34 Years | 0 (0.0%) | 0 (0.0%) |
| 35 to 64 Years | 76 (36.0%) | 70 (17.8%) |
| 65 to 74 Years | 0 (0.0%) | 23 (29.9%) |
| 75 Years and over | 13 (100.0%) | 60 (68.2%) |
Disability Class: Self-Care Difficulty
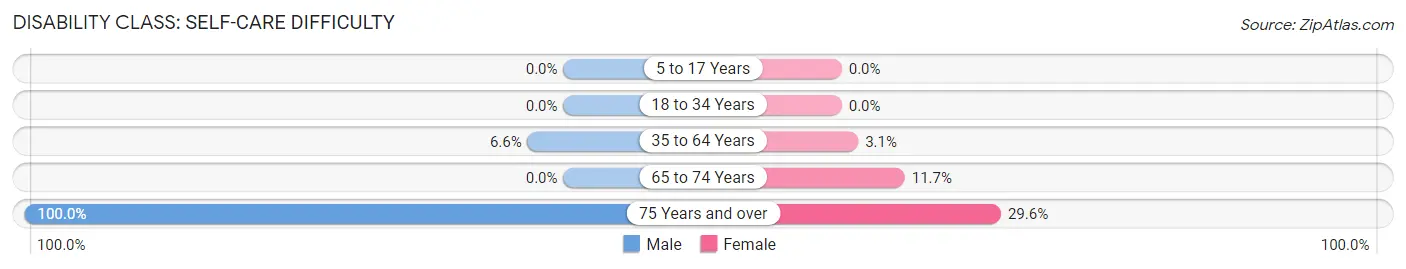
| Age Bracket | Male | Female |
| 5 to 17 Years | 0 (0.0%) | 0 (0.0%) |
| 18 to 34 Years | 0 (0.0%) | 0 (0.0%) |
| 35 to 64 Years | 14 (6.6%) | 12 (3.0%) |
| 65 to 74 Years | 0 (0.0%) | 9 (11.7%) |
| 75 Years and over | 13 (100.0%) | 26 (29.5%) |
Technology Access in Bayamon
Computing Device Access in Bayamon
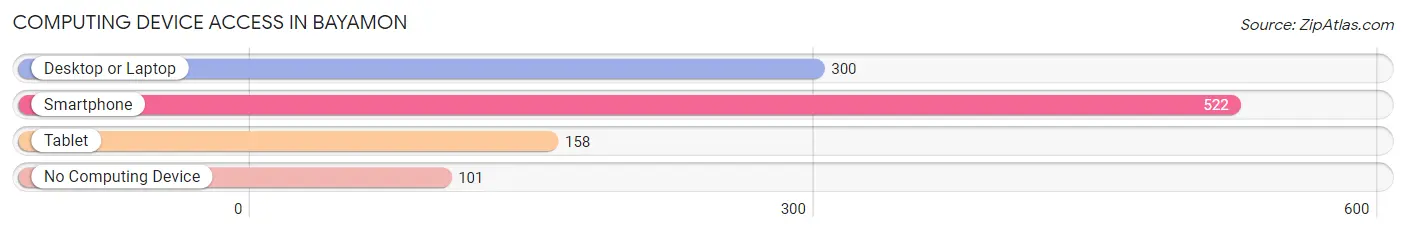
| Device Type | # Households | % Households |
| Desktop or Laptop | 300 | 48.1% |
| Smartphone | 522 | 83.8% |
| Tablet | 158 | 25.4% |
| No Computing Device | 101 | 16.2% |
| Total | 623 | 100.0% |
Internet Access in Bayamon
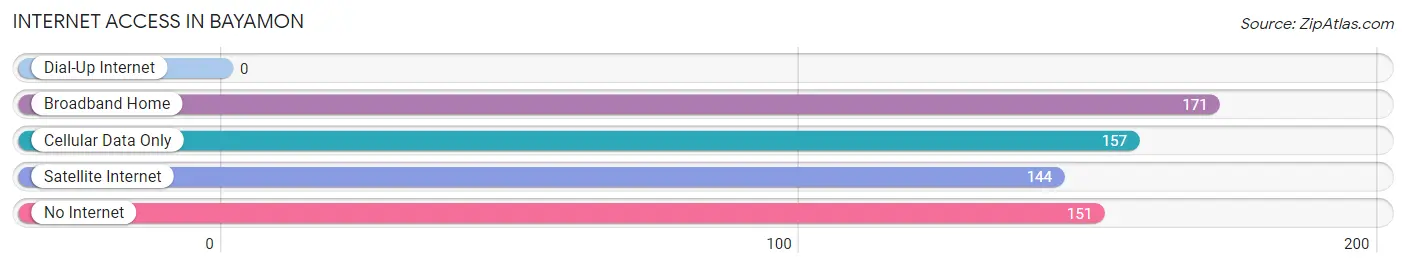
| Internet Type | # Households | % Households |
| Dial-Up Internet | 0 | 0.0% |
| Broadband Home | 171 | 27.5% |
| Cellular Data Only | 157 | 25.2% |
| Satellite Internet | 144 | 23.1% |
| No Internet | 151 | 24.2% |
| Total | 623 | 100.0% |
Bayamon Summary
Bayamon is a municipality located in the northern part of Puerto Rico, in the metropolitan area of San Juan. It is the second most populous municipality in Puerto Rico, with a population of approximately 209,000 people. Bayamon is known for its vibrant culture, its beautiful beaches, and its rich history.
Geography
Bayamon is located in the northern part of Puerto Rico, in the metropolitan area of San Juan. It is bordered by the municipalities of Toa Baja, Toa Alta, Naranjito, and Guaynabo. The municipality is divided into two parts, the urban area and the rural area. The urban area is located in the northern part of the municipality and is home to the majority of the population. The rural area is located in the southern part of the municipality and is home to the majority of the agricultural land. The municipality has a total area of approximately 40 square miles.
Climate
Bayamon has a tropical climate, with temperatures ranging from the mid-70s to the mid-90s throughout the year. The average annual precipitation is approximately 60 inches. The municipality is prone to hurricanes and tropical storms, with the most recent major hurricane being Hurricane Maria in 2017.
History
Bayamon was founded in 1772 by Spanish settlers. The municipality was originally known as San Francisco de la Concepcion de Bayamon. The name was changed to Bayamon in 1838. During the 19th century, Bayamon was an important agricultural center, producing coffee, sugar, and tobacco. In the 20th century, Bayamon became an important industrial center, with the establishment of several factories.
Economy
Bayamon’s economy is largely based on manufacturing and services. The municipality is home to several factories, including pharmaceutical, food processing, and electronics companies. The municipality is also home to several shopping centers, restaurants, and hotels. Tourism is also an important part of the economy, with the municipality being home to several beaches and attractions.
Demographics
As of the 2010 census, Bayamon had a population of 209,000 people. The majority of the population is of Hispanic or Latino origin, with the majority being of Puerto Rican descent. The median household income is approximately $20,000, and the unemployment rate is approximately 10%.
Bayamon is a vibrant municipality with a rich history and culture. It is home to several factories, shopping centers, restaurants, and hotels, making it an important part of the Puerto Rican economy. The municipality is also home to several beaches and attractions, making it a popular tourist destination.
Common Questions
What is Per Capita Income in Bayamon?
Per Capita income in Bayamon is $13,756.
What is the Median Family Income in Bayamon?
Median Family Income in Bayamon is $30,428.
What is the Median Household income in Bayamon?
Median Household Income in Bayamon is $23,224.
What is Income or Wage Gap in Bayamon?
Income or Wage Gap in Bayamon is 27.8%.
Women in Bayamon earn 72.2 cents for every dollar earned by a man.
What is Inequality or Gini Index in Bayamon?
Inequality or Gini Index in Bayamon is 0.48.
What is the Total Population of Bayamon?
Total Population of Bayamon is 1,654.
What is the Total Male Population of Bayamon?
Total Male Population of Bayamon is 723.
What is the Total Female Population of Bayamon?
Total Female Population of Bayamon is 931.
What is the Ratio of Males per 100 Females in Bayamon?
There are 77.66 Males per 100 Females in Bayamon.
What is the Ratio of Females per 100 Males in Bayamon?
There are 128.77 Females per 100 Males in Bayamon.
What is the Median Population Age in Bayamon?
Median Population Age in Bayamon is 36.5 Years.
What is the Average Family Size in Bayamon
Average Family Size in Bayamon is 3.4 People.
What is the Average Household Size in Bayamon
Average Household Size in Bayamon is 2.6 People.
How Large is the Labor Force in Bayamon?
There are 572 People in the Labor Forcein in Bayamon.
What is the Percentage of People in the Labor Force in Bayamon?
44.3% of People are in the Labor Force in Bayamon.
What is the Unemployment Rate in Bayamon?
Unemployment Rate in Bayamon is 12.7%.