Zip Codes with the Highest Percentage of Population with a Degree in Visual and Performing Arts in Carolina, PR
RELATED REPORTS & OPTIONS
Visual and Performing Arts
Carolina
Compare Zip Codes
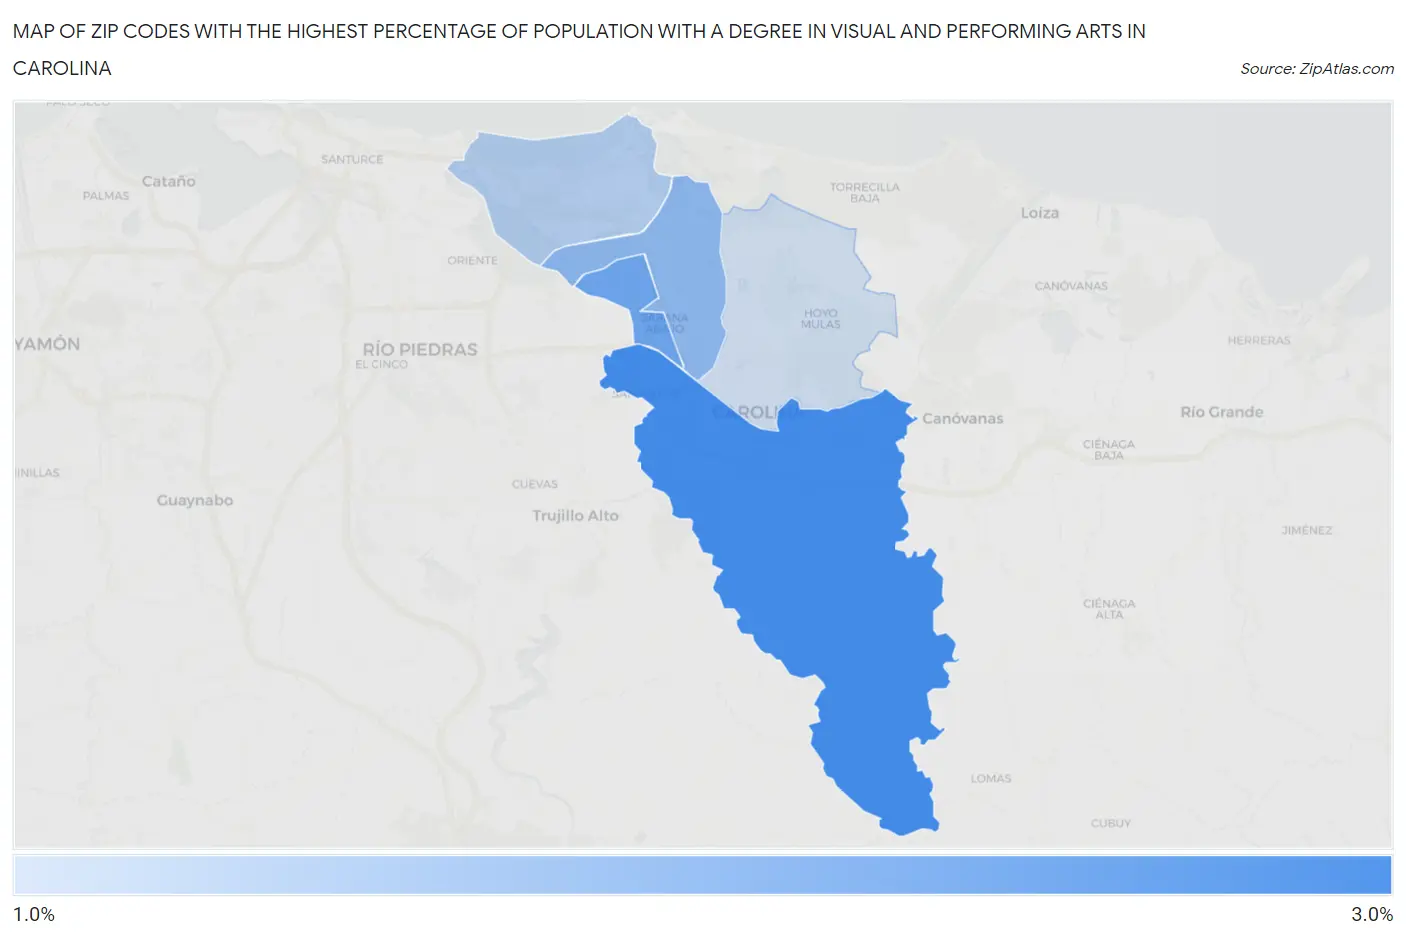
Map of Zip Codes with the Highest Percentage of Population with a Degree in Visual and Performing Arts in Carolina
1.8%
2.7%
Zip Codes with the Highest Percentage of Population with a Degree in Visual and Performing Arts in Carolina, PR
| Zip Code | % Graduates | vs State | vs National | |
| 1. | 00987 | 2.7% | 2.1%(+0.578)#33 | 4.3%(-1.53)#13,791 |
| 2. | 00982 | 2.4% | 2.1%(+0.273)#37 | 4.3%(-1.83)#14,916 |
| 3. | 00983 | 2.2% | 2.1%(+0.062)#46 | 4.3%(-2.04)#15,672 |
| 4. | 00979 | 1.9% | 2.1%(-0.203)#55 | 4.3%(-2.31)#16,642 |
| 5. | 00985 | 1.8% | 2.1%(-0.389)#63 | 4.3%(-2.49)#17,280 |
1
Common Questions
What are the Top 3 Zip Codes with the Highest Percentage of Population with a Degree in Visual and Performing Arts in Carolina, PR?
Top 3 Zip Codes with the Highest Percentage of Population with a Degree in Visual and Performing Arts in Carolina, PR are:
What zip code has the Highest Percentage of Population with a Degree in Visual and Performing Arts in Carolina, PR?
00987 has the Highest Percentage of Population with a Degree in Visual and Performing Arts in Carolina, PR with 2.7%.
What is the Percentage of Population with a Degree in Visual and Performing Arts in Carolina, PR?
Percentage of Population with a Degree in Visual and Performing Arts in Carolina is 2.4%.
What is the Percentage of Population with a Degree in Visual and Performing Arts in Puerto Rico?
Percentage of Population with a Degree in Visual and Performing Arts in Puerto Rico is 2.1%.
What is the Percentage of Population with a Degree in Visual and Performing Arts in the United States?
Percentage of Population with a Degree in Visual and Performing Arts in the United States is 4.3%.