Zip Codes with the Highest Percentage of Population Employed in Food Preparation & Serving in Bayamon, PR
RELATED REPORTS & OPTIONS
Food Preparation & Serving
Bayamon
Compare Zip Codes
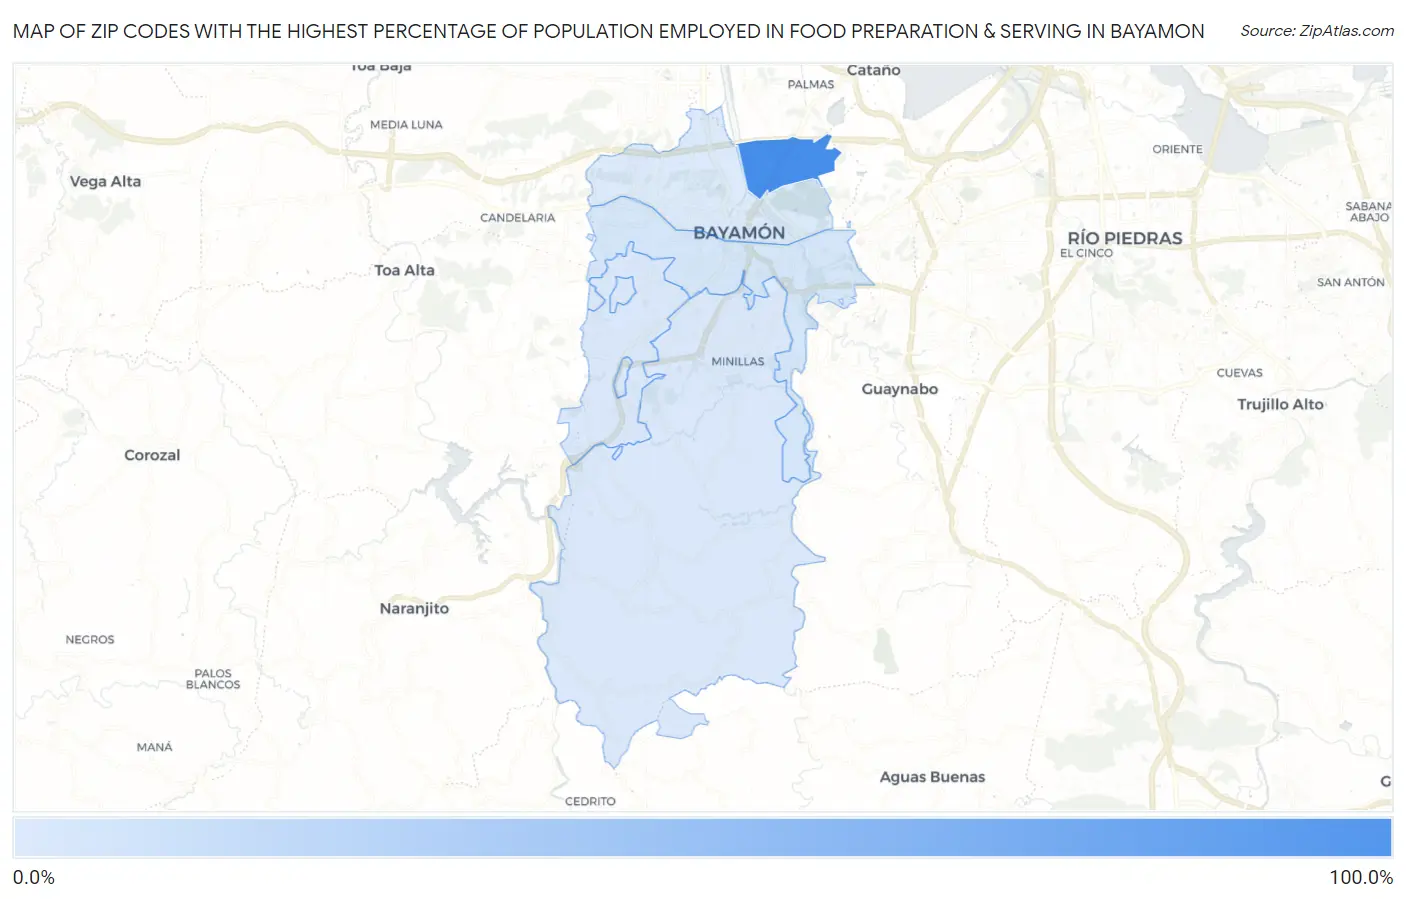
Map of Zip Codes with the Highest Percentage of Population Employed in Food Preparation & Serving in Bayamon
3.1%
100.0%
Zip Codes with the Highest Percentage of Population Employed in Food Preparation & Serving in Bayamon, PR
| Zip Code | % Employed | vs State | vs National | |
| 1. | 00960 | 100.0% | 5.7%(+94.3)#1 | 5.3%(+94.7)#1 |
| 2. | 00959 | 6.8% | 5.7%(+1.15)#39 | 5.3%(+1.55)#6,978 |
| 3. | 00956 | 4.5% | 5.7%(-1.17)#95 | 5.3%(-0.772)#14,968 |
| 4. | 00957 | 4.1% | 5.7%(-1.63)#106 | 5.3%(-1.23)#16,923 |
| 5. | 00961 | 3.1% | 5.7%(-2.54)#113 | 5.3%(-2.15)#20,698 |
1
Common Questions
What are the Top 3 Zip Codes with the Highest Percentage of Population Employed in Food Preparation & Serving in Bayamon, PR?
Top 3 Zip Codes with the Highest Percentage of Population Employed in Food Preparation & Serving in Bayamon, PR are:
What zip code has the Highest Percentage of Population Employed in Food Preparation & Serving in Bayamon, PR?
00960 has the Highest Percentage of Population Employed in Food Preparation & Serving in Bayamon, PR with 100.0%.
What is the Percentage of Population Employed in Food Preparation & Serving in Puerto Rico?
Percentage of Population Employed in Food Preparation & Serving in Puerto Rico is 5.7%.
What is the Percentage of Population Employed in Food Preparation & Serving in the United States?
Percentage of Population Employed in Food Preparation & Serving in the United States is 5.3%.