Zip Codes with the Highest Percentage of Population Employed in Administrative & Support Services in Bayamon, PR
RELATED REPORTS & OPTIONS
Administrative & Support Services
Bayamon
Compare Zip Codes
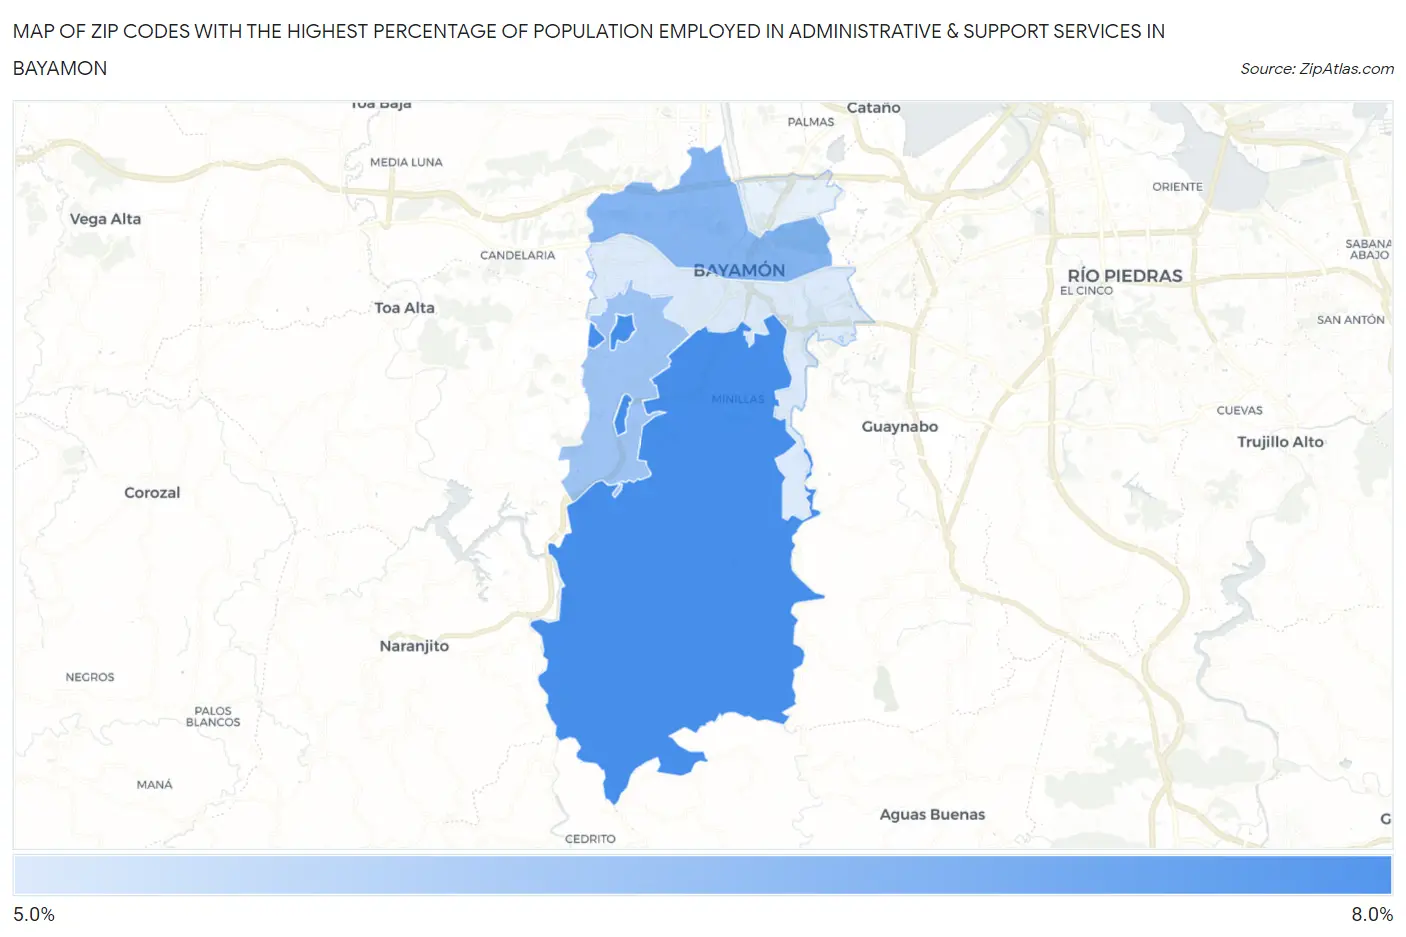
Map of Zip Codes with the Highest Percentage of Population Employed in Administrative & Support Services in Bayamon
5.3%
8.0%
Zip Codes with the Highest Percentage of Population Employed in Administrative & Support Services in Bayamon, PR
| Zip Code | % Employed | vs State | vs National | |
| 1. | 00956 | 8.0% | 6.2%(+1.83)#29 | 4.1%(+3.84)#2,289 |
| 2. | 00961 | 6.9% | 6.2%(+0.705)#42 | 4.1%(+2.71)#3,404 |
| 3. | 00957 | 6.4% | 6.2%(+0.265)#48 | 4.1%(+2.27)#4,042 |
| 4. | 00959 | 5.3% | 6.2%(-0.820)#75 | 4.1%(+1.18)#6,241 |
1
Common Questions
What are the Top 3 Zip Codes with the Highest Percentage of Population Employed in Administrative & Support Services in Bayamon, PR?
Top 3 Zip Codes with the Highest Percentage of Population Employed in Administrative & Support Services in Bayamon, PR are:
What zip code has the Highest Percentage of Population Employed in Administrative & Support Services in Bayamon, PR?
00956 has the Highest Percentage of Population Employed in Administrative & Support Services in Bayamon, PR with 8.0%.
What is the Percentage of Population Employed in Administrative & Support Services in Bayamon, PR?
Percentage of Population Employed in Administrative & Support Services in Bayamon is 9.6%.
What is the Percentage of Population Employed in Administrative & Support Services in Puerto Rico?
Percentage of Population Employed in Administrative & Support Services in Puerto Rico is 6.2%.
What is the Percentage of Population Employed in Administrative & Support Services in the United States?
Percentage of Population Employed in Administrative & Support Services in the United States is 4.1%.