Zip Codes with the Highest Percentage of Households Without a Vehicle in Bayamon, PR
RELATED REPORTS & OPTIONS
Households without a Cars
Bayamon
Compare Zip Codes
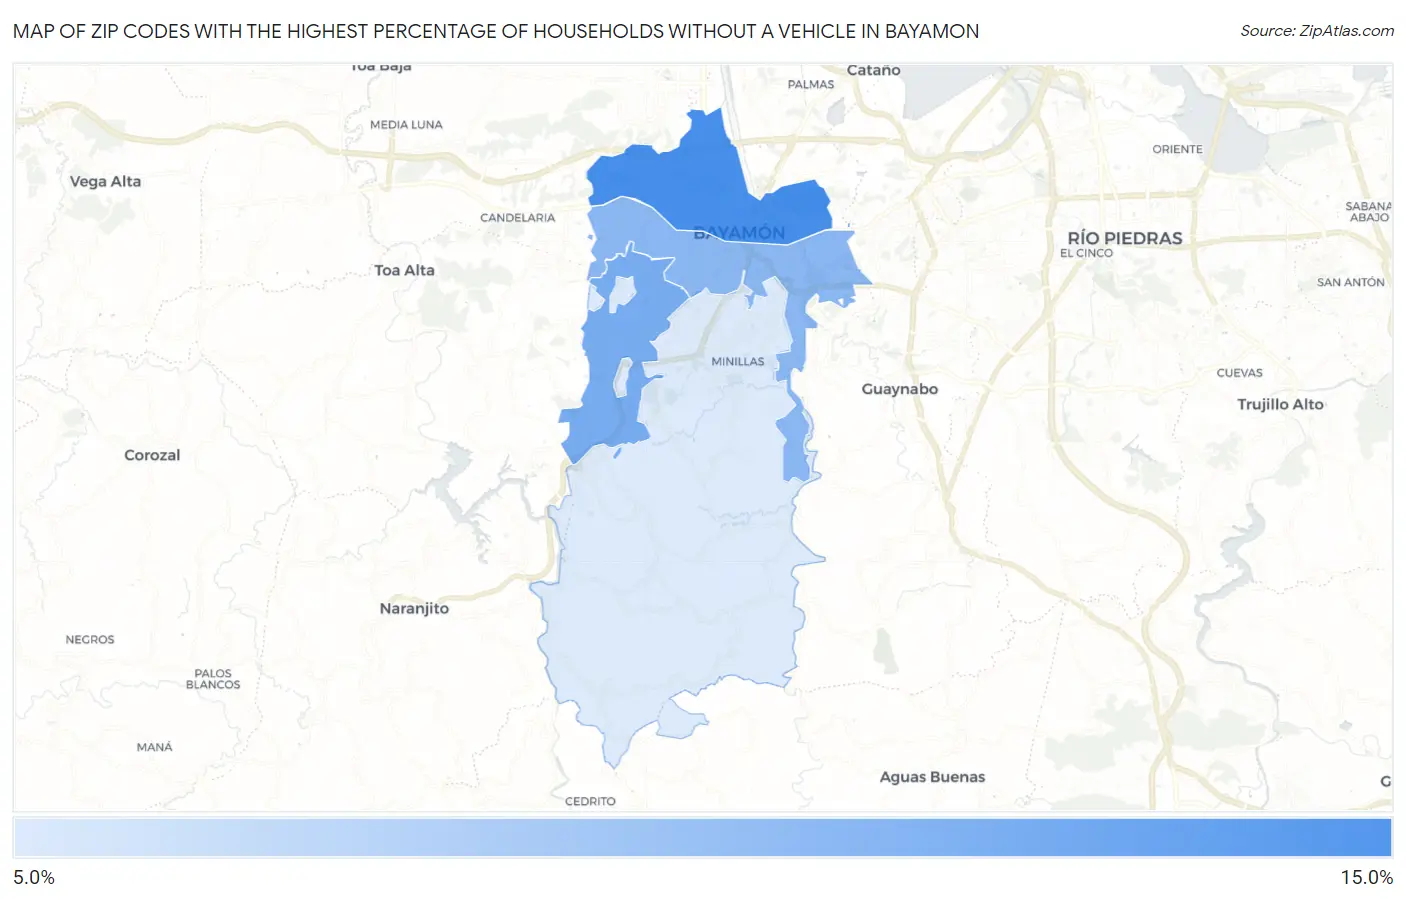
Map of Zip Codes with the Highest Percentage of Households Without a Vehicle in Bayamon
10.9%
14.2%
Zip Codes with the Highest Percentage of Households Without a Vehicle in Bayamon, PR
| Zip Code | Housholds Without a Car | vs State | vs National | |
| 1. | 00961 | 14.2% | 14.0%(+0.200)#53 | 8.3%(+5.90)#2,624 |
| 2. | 00957 | 13.1% | 14.0%(-0.900)#65 | 8.3%(+4.80)#3,044 |
| 3. | 00959 | 12.7% | 14.0%(-1.30)#70 | 8.3%(+4.40)#3,219 |
| 4. | 00956 | 10.9% | 14.0%(-3.10)#95 | 8.3%(+2.60)#4,176 |
1
Common Questions
What are the Top 3 Zip Codes with the Highest Percentage of Households Without a Vehicle in Bayamon, PR?
Top 3 Zip Codes with the Highest Percentage of Households Without a Vehicle in Bayamon, PR are:
What zip code has the Highest Percentage of Households Without a Vehicle in Bayamon, PR?
00961 has the Highest Percentage of Households Without a Vehicle in Bayamon, PR with 14.2%.
What is the Percentage of Households Without a Vehicle in Bayamon, PR?
Percentage of Households Without a Vehicle in Bayamon is 17.3%.
What is the Percentage of Households Without a Vehicle in Puerto Rico?
Percentage of Households Without a Vehicle in Puerto Rico is 14.0%.
What is the Percentage of Households Without a Vehicle in the United States?
Percentage of Households Without a Vehicle in the United States is 8.3%.