Zip Codes with the Highest Percentage of Indian (Asian) Population in Bayamon, PR
RELATED REPORTS & OPTIONS
Indian (Asian)
Bayamon
Compare Zip Codes
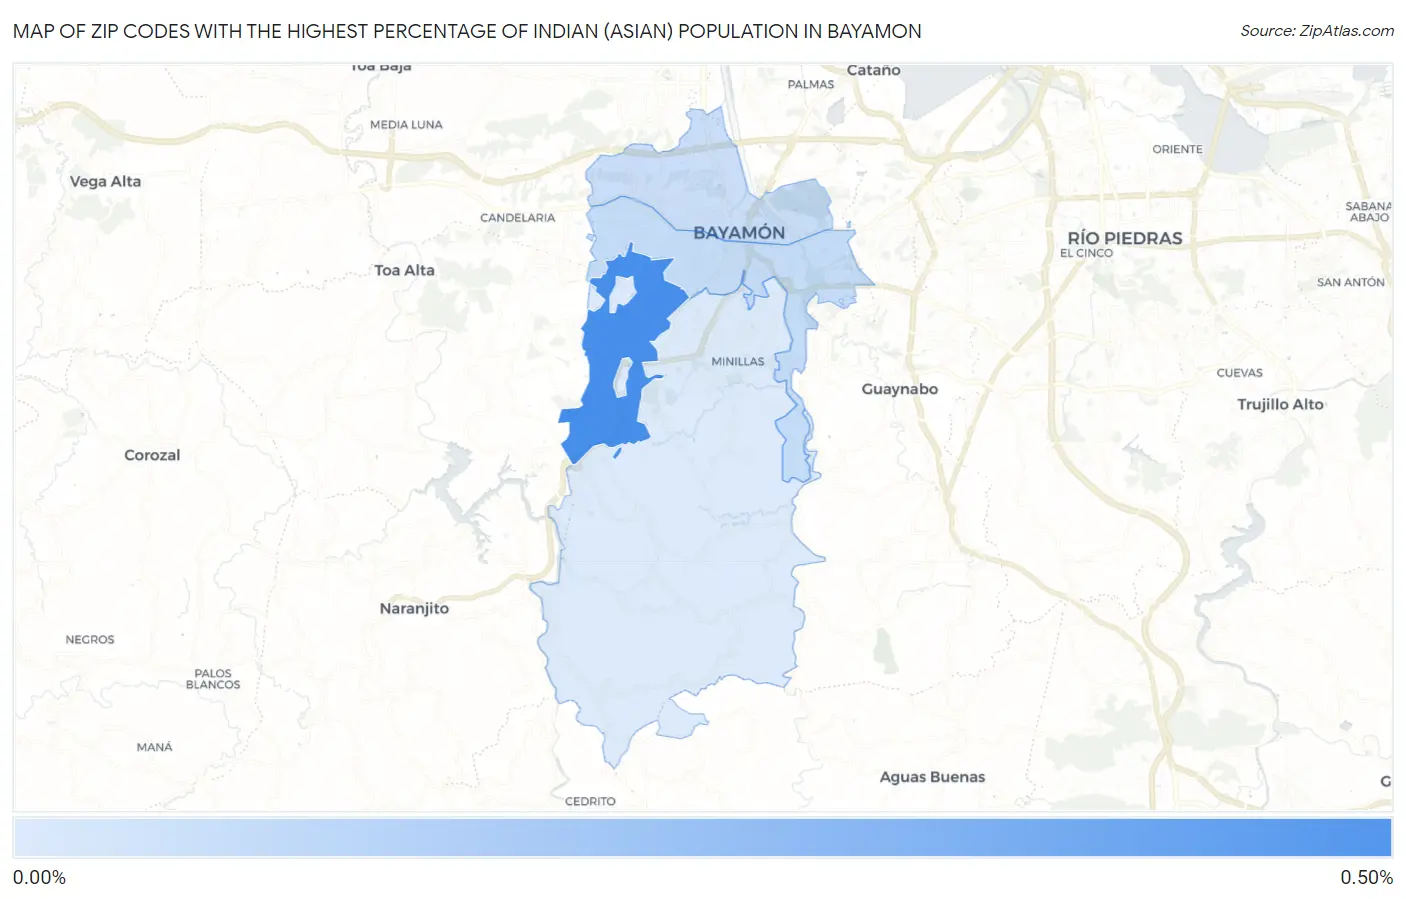
Map of Zip Codes with the Highest Percentage of Indian (Asian) Population in Bayamon
0.033%
0.42%
Zip Codes with the Highest Percentage of Indian (Asian) Population in Bayamon, PR
| Zip Code | Indian (Asian) | vs State | vs National | |
| 1. | 00957 | 0.42% | 0.077%(+0.347)#16 | 1.61%(-1.18)#7,936 |
| 2. | 00959 | 0.092% | 0.077%(+0.015)#24 | 1.61%(-1.52)#11,973 |
| 3. | 00961 | 0.082% | 0.077%(+0.005)#28 | 1.61%(-1.53)#12,161 |
| 4. | 00956 | 0.033% | 0.077%(-0.044)#38 | 1.61%(-1.58)#12,960 |
1
Common Questions
What are the Top 3 Zip Codes with the Highest Percentage of Indian (Asian) Population in Bayamon, PR?
Top 3 Zip Codes with the Highest Percentage of Indian (Asian) Population in Bayamon, PR are:
What zip code has the Highest Percentage of Indian (Asian) Population in Bayamon, PR?
00957 has the Highest Percentage of Indian (Asian) Population in Bayamon, PR with 0.42%.
What is the Percentage of Indian (Asian) Population in Puerto Rico?
Percentage of Indian (Asian) Population in Puerto Rico is 0.077%.
What is the Percentage of Indian (Asian) Population in the United States?
Percentage of Indian (Asian) Population in the United States is 1.61%.