Zip Codes with the Highest Percentage of Population Walking to Work in Bayamon, PR
RELATED REPORTS & OPTIONS
Walk to Work
Bayamon
Compare Zip Codes
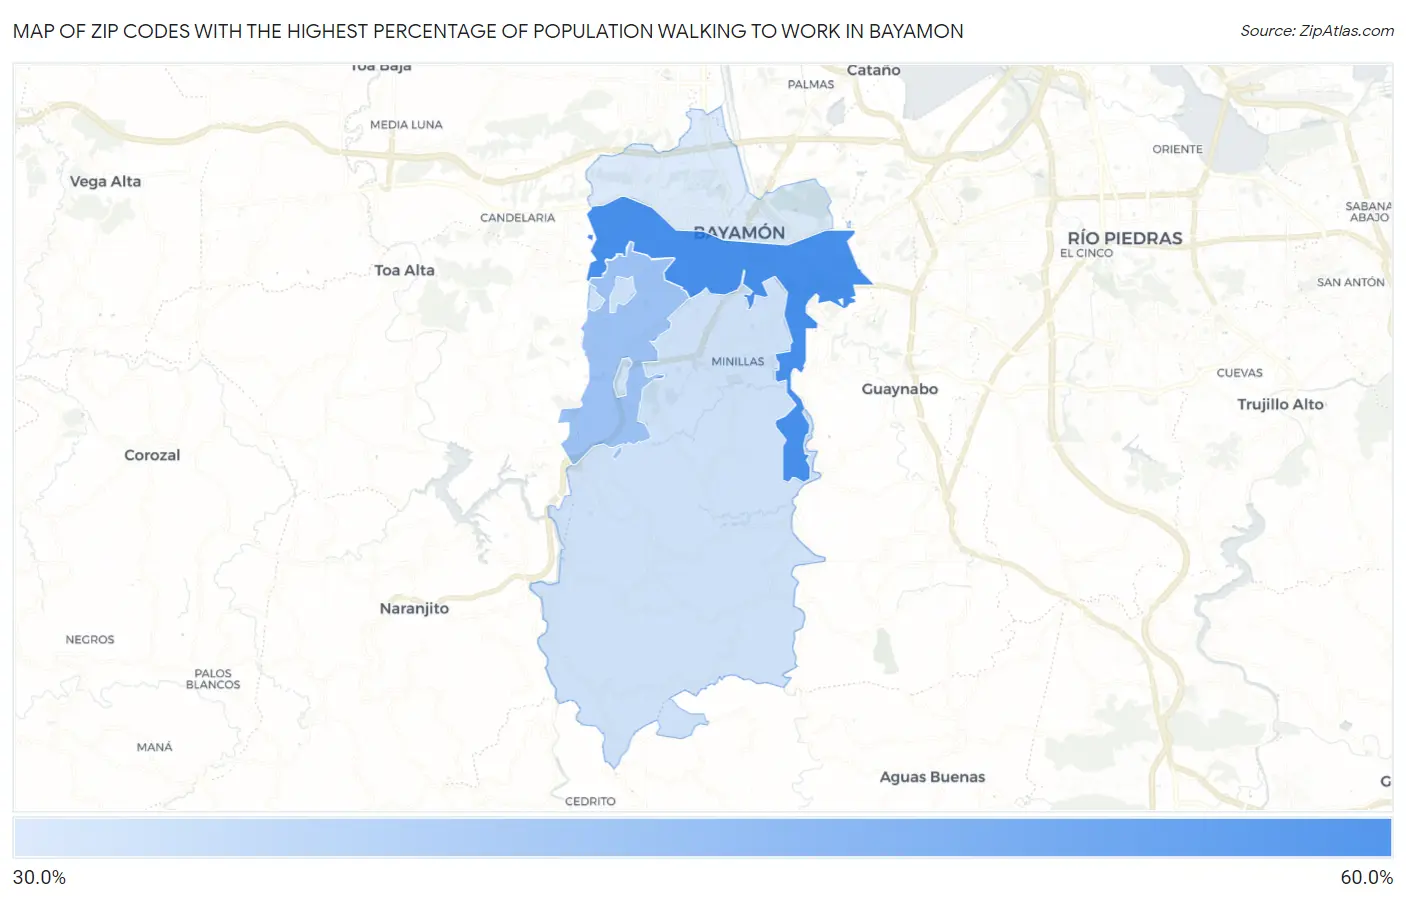
Map of Zip Codes with the Highest Percentage of Population Walking to Work in Bayamon
36.4%
56.7%
Zip Codes with the Highest Percentage of Population Walking to Work in Bayamon, PR
| Zip Code | % Walk to Work | vs State | vs National | |
| 1. | 00959 | 56.7% | 43.5%(+13.2)#7 | 33.4%(+23.3)#2,342 |
| 2. | 00957 | 44.9% | 43.5%(+1.40)#45 | 33.4%(+11.5)#6,423 |
| 3. | 00956 | 38.2% | 43.5%(-5.30)#78 | 33.4%(+4.80)#9,145 |
| 4. | 00961 | 36.4% | 43.5%(-7.10)#84 | 33.4%(+3.00)#9,921 |
1
Common Questions
What are the Top 3 Zip Codes with the Highest Percentage of Population Walking to Work in Bayamon, PR?
Top 3 Zip Codes with the Highest Percentage of Population Walking to Work in Bayamon, PR are:
What zip code has the Highest Percentage of Population Walking to Work in Bayamon, PR?
00959 has the Highest Percentage of Population Walking to Work in Bayamon, PR with 56.7%.
What is the Percentage of Population Walking to Work in Puerto Rico?
Percentage of Population Walking to Work in Puerto Rico is 43.5%.
What is the Percentage of Population Walking to Work in the United States?
Percentage of Population Walking to Work in the United States is 33.4%.