Zip Codes with the Highest Percentage of Population Employed in Architecture & Engineering in Bayamon, PR
RELATED REPORTS & OPTIONS
Architecture & Engineering
Bayamon
Compare Zip Codes
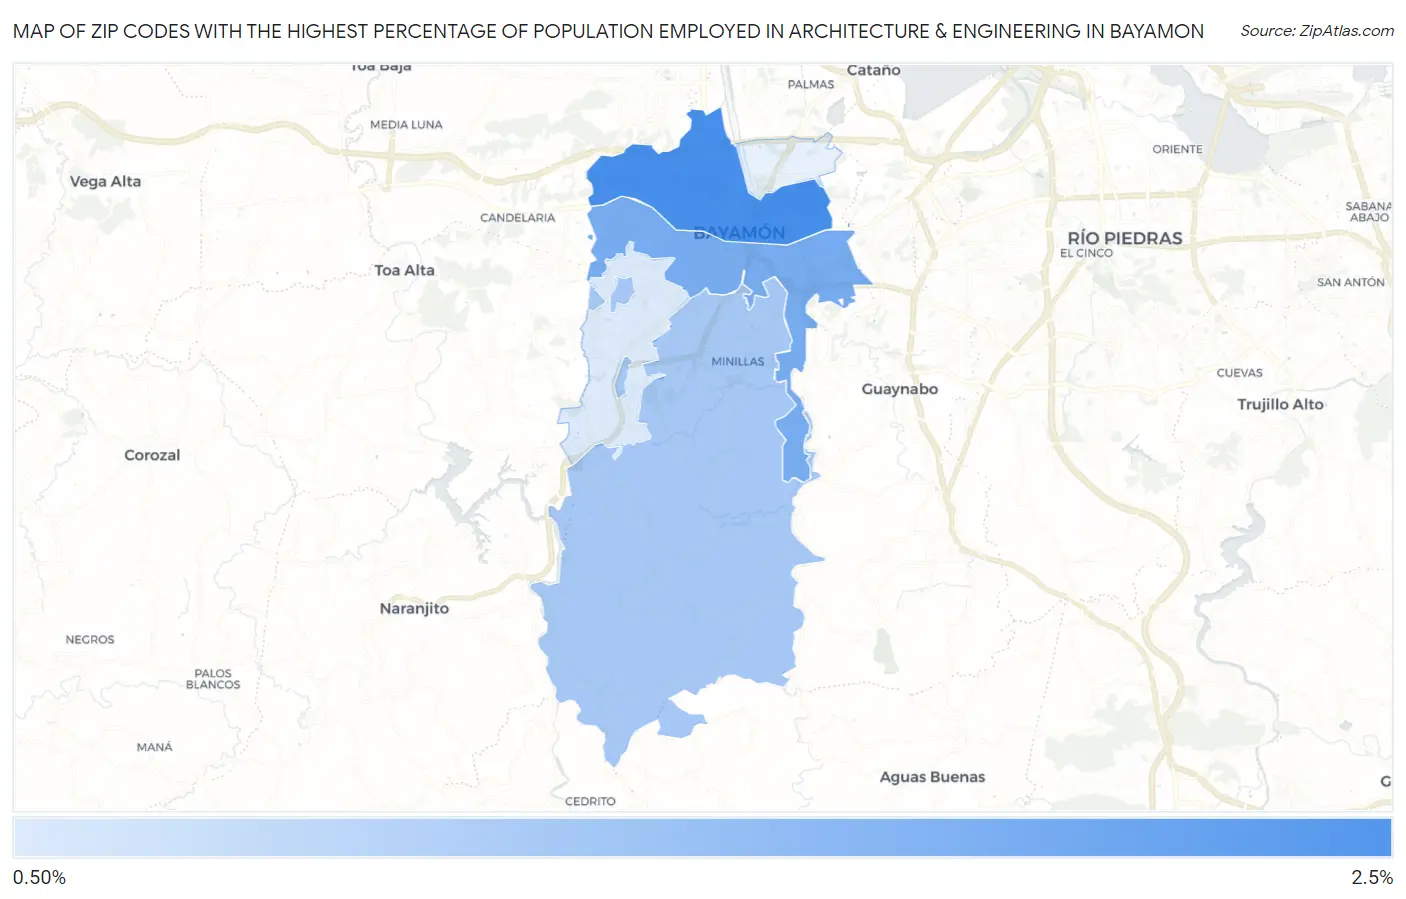
Map of Zip Codes with the Highest Percentage of Population Employed in Architecture & Engineering in Bayamon
0.92%
2.1%
Zip Codes with the Highest Percentage of Population Employed in Architecture & Engineering in Bayamon, PR
| Zip Code | % Employed | vs State | vs National | |
| 1. | 00961 | 2.1% | 1.4%(+0.627)#28 | 2.1%(-0.074)#9,177 |
| 2. | 00959 | 1.7% | 1.4%(+0.245)#42 | 2.1%(-0.455)#11,541 |
| 3. | 00956 | 1.4% | 1.4%(-0.098)#54 | 2.1%(-0.799)#13,956 |
| 4. | 00957 | 0.92% | 1.4%(-0.529)#85 | 2.1%(-1.23)#17,212 |
1
Common Questions
What are the Top 3 Zip Codes with the Highest Percentage of Population Employed in Architecture & Engineering in Bayamon, PR?
Top 3 Zip Codes with the Highest Percentage of Population Employed in Architecture & Engineering in Bayamon, PR are:
What zip code has the Highest Percentage of Population Employed in Architecture & Engineering in Bayamon, PR?
00961 has the Highest Percentage of Population Employed in Architecture & Engineering in Bayamon, PR with 2.1%.
What is the Percentage of Population Employed in Architecture & Engineering in Puerto Rico?
Percentage of Population Employed in Architecture & Engineering in Puerto Rico is 1.4%.
What is the Percentage of Population Employed in Architecture & Engineering in the United States?
Percentage of Population Employed in Architecture & Engineering in the United States is 2.1%.