Ute vs West Indian Family Poverty
COMPARE
Ute
West Indian
Family Poverty
Family Poverty Comparison
Ute
West Indians
12.1%
FAMILY POVERTY
0.0/ 100
METRIC RATING
311th/ 347
METRIC RANK
11.5%
FAMILY POVERTY
0.0/ 100
METRIC RATING
290th/ 347
METRIC RANK
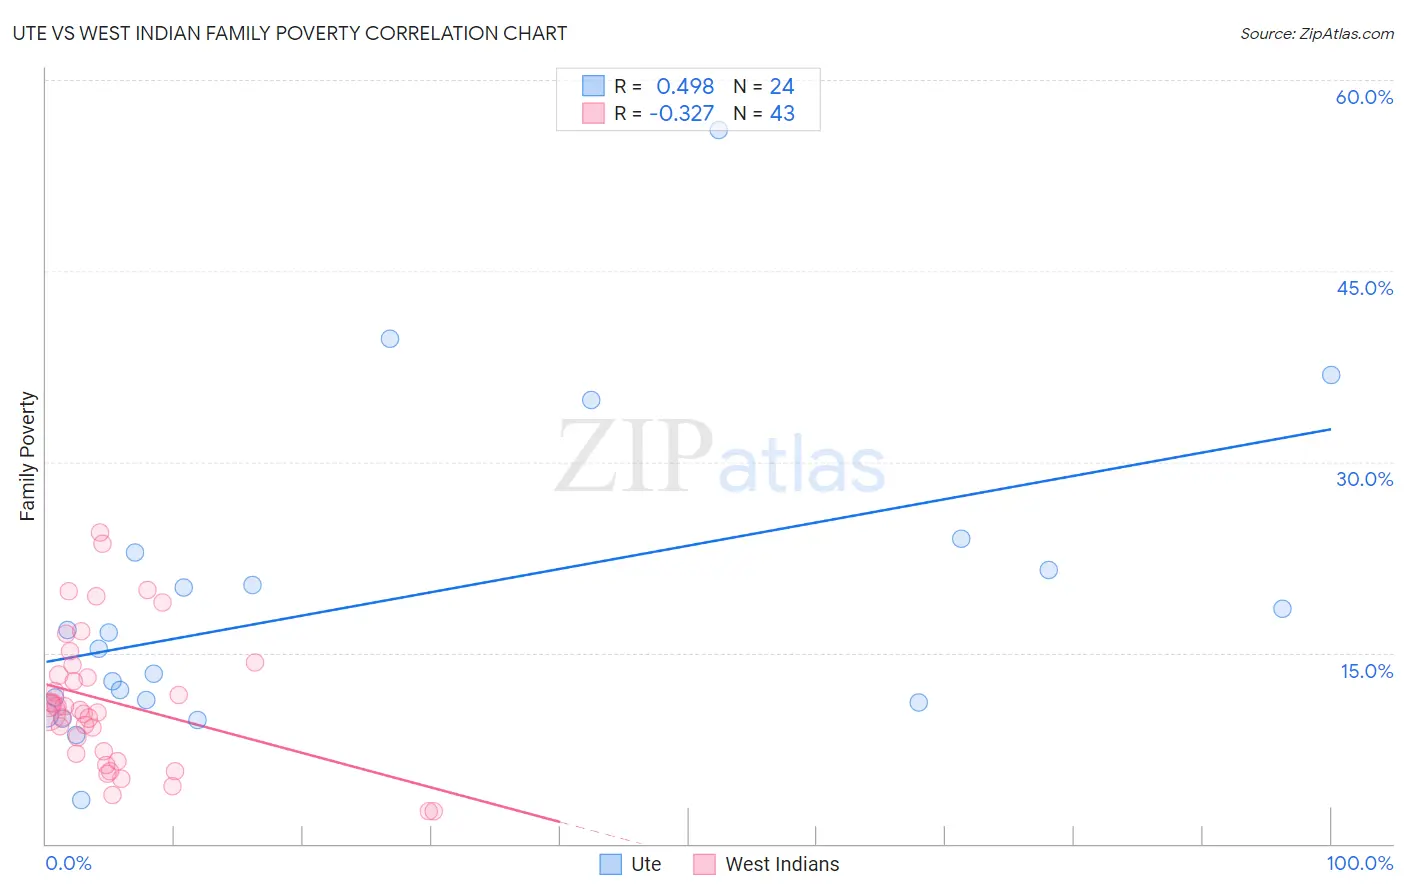
Ute vs West Indian Family Poverty Correlation Chart
The statistical analysis conducted on geographies consisting of 55,645,170 people shows a moderate positive correlation between the proportion of Ute and poverty level among families in the United States with a correlation coefficient (R) of 0.498 and weighted average of 12.1%. Similarly, the statistical analysis conducted on geographies consisting of 253,611,735 people shows a mild negative correlation between the proportion of West Indians and poverty level among families in the United States with a correlation coefficient (R) of -0.327 and weighted average of 11.5%, a difference of 4.6%.
Family Poverty Correlation Summary
| Measurement | Ute | West Indian |
| Minimum | 3.5% | 2.5% |
| Maximum | 56.1% | 24.5% |
| Range | 52.6% | 22.0% |
| Mean | 19.0% | 11.2% |
| Median | 15.9% | 10.5% |
| Interquartile 25% (IQ1) | 11.2% | 7.1% |
| Interquartile 75% (IQ3) | 22.2% | 14.0% |
| Interquartile Range (IQR) | 11.0% | 6.9% |
| Standard Deviation (Sample) | 12.1% | 5.3% |
| Standard Deviation (Population) | 11.8% | 5.3% |
Similar Demographics by Family Poverty
Demographics Similar to Ute by Family Poverty
In terms of family poverty, the demographic groups most similar to Ute are Immigrants from Central America (12.1%, a difference of 0.38%), Hispanic or Latino (12.0%, a difference of 0.84%), Immigrants from Guatemala (12.0%, a difference of 0.84%), Immigrants from Caribbean (12.2%, a difference of 1.1%), and Seminole (11.9%, a difference of 1.3%).
| Demographics | Rating | Rank | Family Poverty |
| Immigrants | Latin America | 0.0 /100 | #304 | Tragic 11.8% |
| Mexicans | 0.0 /100 | #305 | Tragic 11.8% |
| Cajuns | 0.0 /100 | #306 | Tragic 11.9% |
| Immigrants | Congo | 0.0 /100 | #307 | Tragic 11.9% |
| Seminole | 0.0 /100 | #308 | Tragic 11.9% |
| Hispanics or Latinos | 0.0 /100 | #309 | Tragic 12.0% |
| Immigrants | Guatemala | 0.0 /100 | #310 | Tragic 12.0% |
| Ute | 0.0 /100 | #311 | Tragic 12.1% |
| Immigrants | Central America | 0.0 /100 | #312 | Tragic 12.1% |
| Immigrants | Caribbean | 0.0 /100 | #313 | Tragic 12.2% |
| Kiowa | 0.0 /100 | #314 | Tragic 12.2% |
| Immigrants | Mexico | 0.0 /100 | #315 | Tragic 12.3% |
| Hondurans | 0.0 /100 | #316 | Tragic 12.4% |
| Immigrants | Grenada | 0.0 /100 | #317 | Tragic 12.4% |
| U.S. Virgin Islanders | 0.0 /100 | #318 | Tragic 12.4% |
Demographics Similar to West Indians by Family Poverty
In terms of family poverty, the demographic groups most similar to West Indians are Immigrants from Barbados (11.5%, a difference of 0.010%), Immigrants from Belize (11.5%, a difference of 0.060%), Haitian (11.5%, a difference of 0.060%), Immigrants from Somalia (11.5%, a difference of 0.17%), and Vietnamese (11.5%, a difference of 0.25%).
| Demographics | Rating | Rank | Family Poverty |
| Indonesians | 0.0 /100 | #283 | Tragic 11.3% |
| Yaqui | 0.0 /100 | #284 | Tragic 11.3% |
| Barbadians | 0.0 /100 | #285 | Tragic 11.3% |
| Senegalese | 0.0 /100 | #286 | Tragic 11.5% |
| Vietnamese | 0.0 /100 | #287 | Tragic 11.5% |
| Immigrants | Belize | 0.0 /100 | #288 | Tragic 11.5% |
| Immigrants | Barbados | 0.0 /100 | #289 | Tragic 11.5% |
| West Indians | 0.0 /100 | #290 | Tragic 11.5% |
| Haitians | 0.0 /100 | #291 | Tragic 11.5% |
| Immigrants | Somalia | 0.0 /100 | #292 | Tragic 11.5% |
| Immigrants | Cabo Verde | 0.0 /100 | #293 | Tragic 11.6% |
| Immigrants | St. Vincent and the Grenadines | 0.0 /100 | #294 | Tragic 11.6% |
| Immigrants | Haiti | 0.0 /100 | #295 | Tragic 11.6% |
| Choctaw | 0.0 /100 | #296 | Tragic 11.6% |
| Creek | 0.0 /100 | #297 | Tragic 11.7% |