Colombian vs West Indian Family Poverty
COMPARE
Colombian
West Indian
Family Poverty
Family Poverty Comparison
Colombians
West Indians
9.2%
FAMILY POVERTY
36.1/ 100
METRIC RATING
186th/ 347
METRIC RANK
11.5%
FAMILY POVERTY
0.0/ 100
METRIC RATING
290th/ 347
METRIC RANK
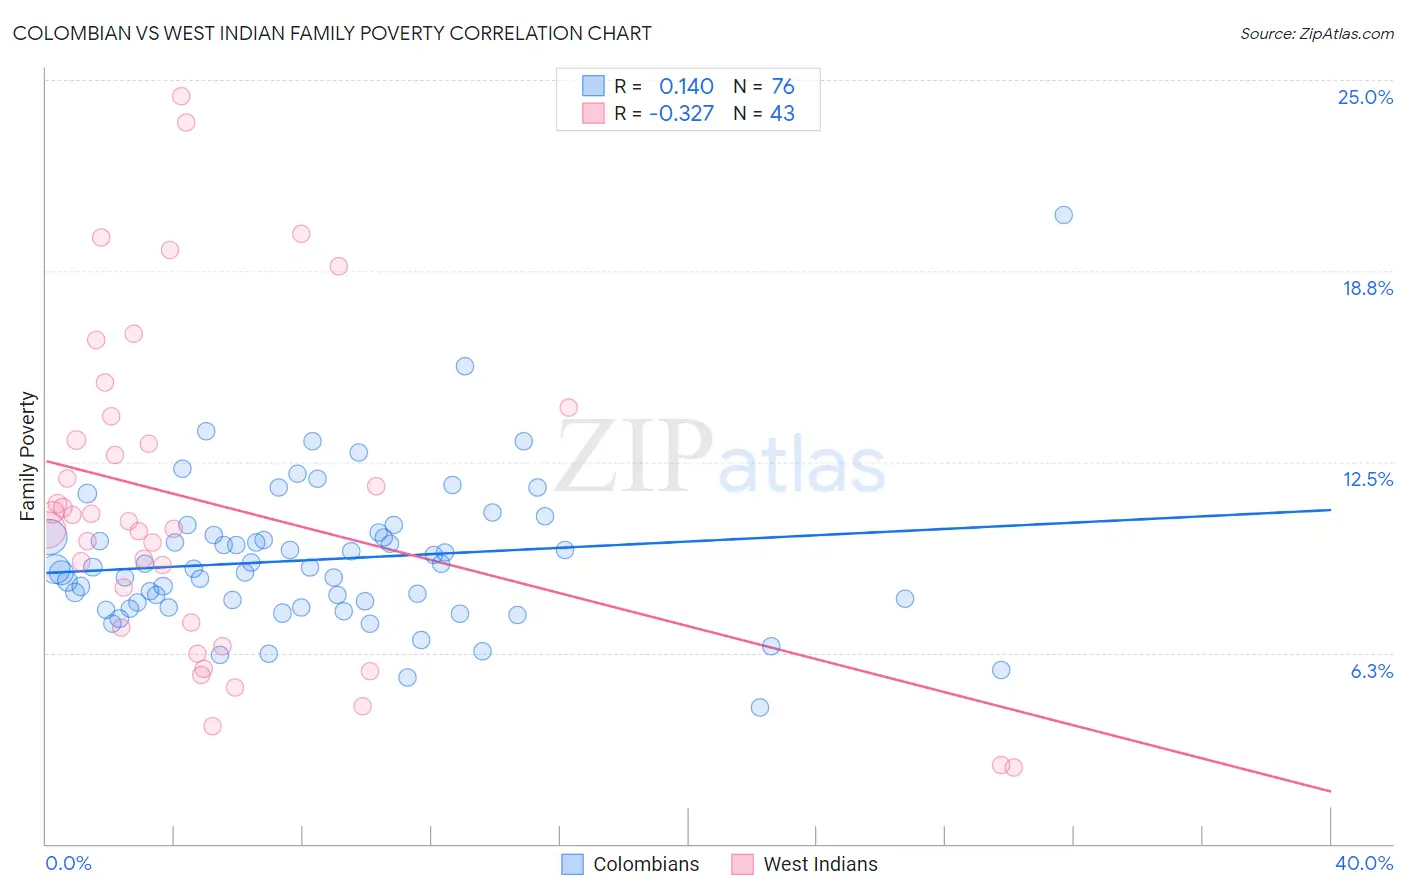
Colombian vs West Indian Family Poverty Correlation Chart
The statistical analysis conducted on geographies consisting of 418,403,011 people shows a poor positive correlation between the proportion of Colombians and poverty level among families in the United States with a correlation coefficient (R) of 0.140 and weighted average of 9.2%. Similarly, the statistical analysis conducted on geographies consisting of 253,611,735 people shows a mild negative correlation between the proportion of West Indians and poverty level among families in the United States with a correlation coefficient (R) of -0.327 and weighted average of 11.5%, a difference of 25.6%.
Family Poverty Correlation Summary
| Measurement | Colombian | West Indian |
| Minimum | 4.5% | 2.5% |
| Maximum | 20.6% | 24.5% |
| Range | 16.1% | 22.0% |
| Mean | 9.3% | 11.2% |
| Median | 9.0% | 10.5% |
| Interquartile 25% (IQ1) | 7.8% | 7.1% |
| Interquartile 75% (IQ3) | 10.1% | 14.0% |
| Interquartile Range (IQR) | 2.3% | 6.9% |
| Standard Deviation (Sample) | 2.4% | 5.3% |
| Standard Deviation (Population) | 2.4% | 5.3% |
Similar Demographics by Family Poverty
Demographics Similar to Colombians by Family Poverty
In terms of family poverty, the demographic groups most similar to Colombians are Delaware (9.2%, a difference of 0.090%), Immigrants from Kenya (9.2%, a difference of 0.29%), Immigrants from Saudi Arabia (9.1%, a difference of 0.35%), South American Indian (9.1%, a difference of 0.36%), and Uruguayan (9.1%, a difference of 0.43%).
| Demographics | Rating | Rank | Family Poverty |
| Immigrants | Iraq | 44.4 /100 | #179 | Average 9.1% |
| Immigrants | Uganda | 43.4 /100 | #180 | Average 9.1% |
| Hmong | 40.2 /100 | #181 | Average 9.1% |
| Immigrants | Morocco | 40.2 /100 | #182 | Average 9.1% |
| Uruguayans | 39.2 /100 | #183 | Fair 9.1% |
| South American Indians | 38.7 /100 | #184 | Fair 9.1% |
| Immigrants | Saudi Arabia | 38.6 /100 | #185 | Fair 9.1% |
| Colombians | 36.1 /100 | #186 | Fair 9.2% |
| Delaware | 35.4 /100 | #187 | Fair 9.2% |
| Immigrants | Kenya | 34.0 /100 | #188 | Fair 9.2% |
| Immigrants | Afghanistan | 32.1 /100 | #189 | Fair 9.2% |
| Arabs | 31.5 /100 | #190 | Fair 9.2% |
| Ugandans | 28.7 /100 | #191 | Fair 9.3% |
| Spanish | 28.7 /100 | #192 | Fair 9.3% |
| Immigrants | Western Asia | 28.2 /100 | #193 | Fair 9.3% |
Demographics Similar to West Indians by Family Poverty
In terms of family poverty, the demographic groups most similar to West Indians are Immigrants from Barbados (11.5%, a difference of 0.010%), Immigrants from Belize (11.5%, a difference of 0.060%), Haitian (11.5%, a difference of 0.060%), Immigrants from Somalia (11.5%, a difference of 0.17%), and Vietnamese (11.5%, a difference of 0.25%).
| Demographics | Rating | Rank | Family Poverty |
| Indonesians | 0.0 /100 | #283 | Tragic 11.3% |
| Yaqui | 0.0 /100 | #284 | Tragic 11.3% |
| Barbadians | 0.0 /100 | #285 | Tragic 11.3% |
| Senegalese | 0.0 /100 | #286 | Tragic 11.5% |
| Vietnamese | 0.0 /100 | #287 | Tragic 11.5% |
| Immigrants | Belize | 0.0 /100 | #288 | Tragic 11.5% |
| Immigrants | Barbados | 0.0 /100 | #289 | Tragic 11.5% |
| West Indians | 0.0 /100 | #290 | Tragic 11.5% |
| Haitians | 0.0 /100 | #291 | Tragic 11.5% |
| Immigrants | Somalia | 0.0 /100 | #292 | Tragic 11.5% |
| Immigrants | Cabo Verde | 0.0 /100 | #293 | Tragic 11.6% |
| Immigrants | St. Vincent and the Grenadines | 0.0 /100 | #294 | Tragic 11.6% |
| Immigrants | Haiti | 0.0 /100 | #295 | Tragic 11.6% |
| Choctaw | 0.0 /100 | #296 | Tragic 11.6% |
| Creek | 0.0 /100 | #297 | Tragic 11.7% |