Ute vs Immigrants from South America Family Poverty
COMPARE
Ute
Immigrants from South America
Family Poverty
Family Poverty Comparison
Ute
Immigrants from South America
12.1%
FAMILY POVERTY
0.0/ 100
METRIC RATING
311th/ 347
METRIC RANK
9.5%
FAMILY POVERTY
18.0/ 100
METRIC RATING
206th/ 347
METRIC RANK
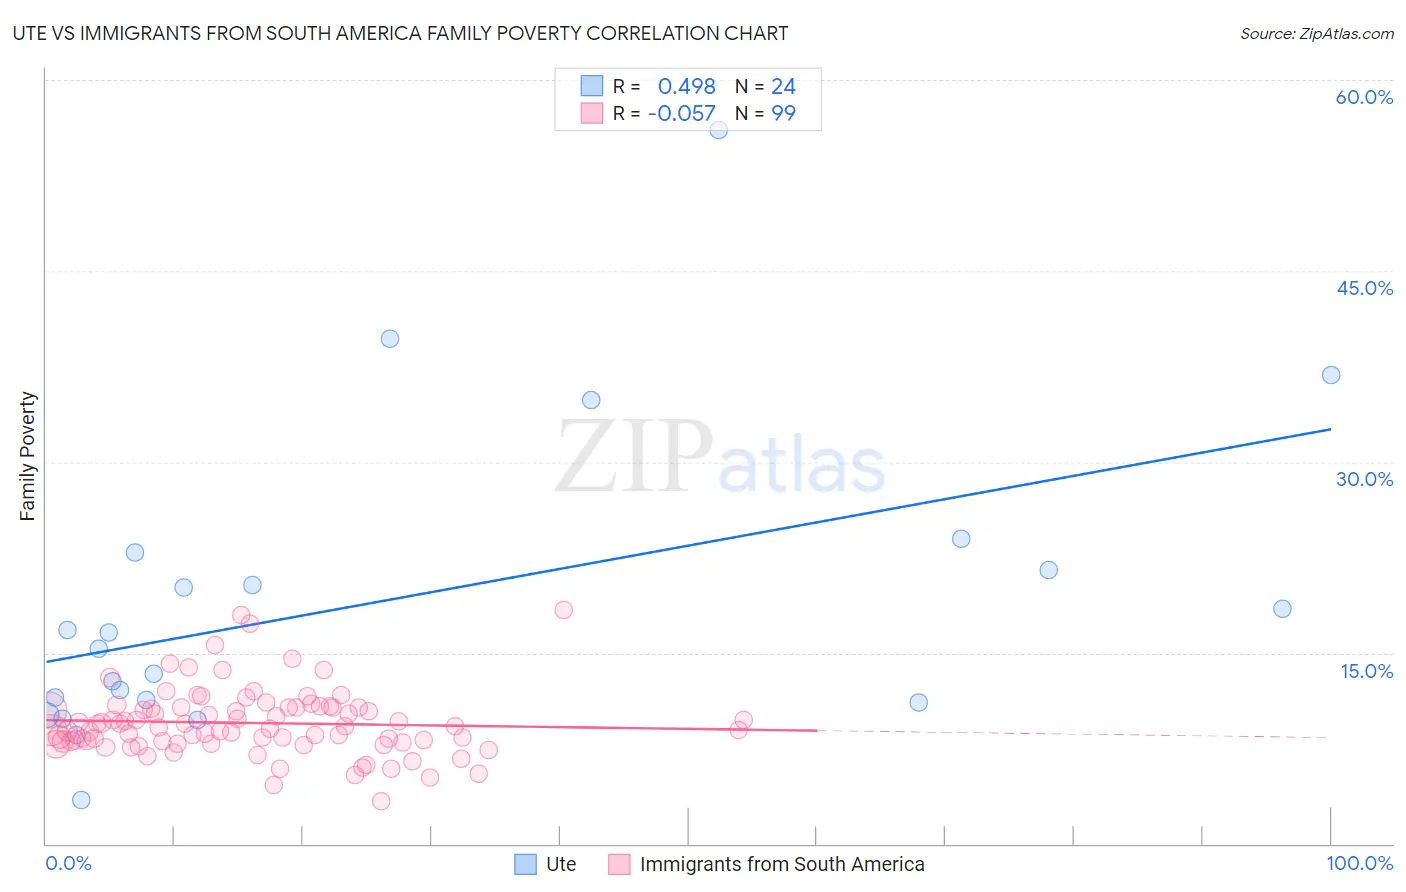
Ute vs Immigrants from South America Family Poverty Correlation Chart
The statistical analysis conducted on geographies consisting of 55,645,170 people shows a moderate positive correlation between the proportion of Ute and poverty level among families in the United States with a correlation coefficient (R) of 0.498 and weighted average of 12.1%. Similarly, the statistical analysis conducted on geographies consisting of 484,267,691 people shows a slight negative correlation between the proportion of Immigrants from South America and poverty level among families in the United States with a correlation coefficient (R) of -0.057 and weighted average of 9.5%, a difference of 27.5%.
Family Poverty Correlation Summary
| Measurement | Ute | Immigrants from South America |
| Minimum | 3.5% | 3.3% |
| Maximum | 56.1% | 18.4% |
| Range | 52.6% | 15.1% |
| Mean | 19.0% | 9.5% |
| Median | 15.9% | 9.1% |
| Interquartile 25% (IQ1) | 11.2% | 8.0% |
| Interquartile 75% (IQ3) | 22.2% | 10.7% |
| Interquartile Range (IQR) | 11.0% | 2.7% |
| Standard Deviation (Sample) | 12.1% | 2.6% |
| Standard Deviation (Population) | 11.8% | 2.6% |
Similar Demographics by Family Poverty
Demographics Similar to Ute by Family Poverty
In terms of family poverty, the demographic groups most similar to Ute are Immigrants from Central America (12.1%, a difference of 0.38%), Hispanic or Latino (12.0%, a difference of 0.84%), Immigrants from Guatemala (12.0%, a difference of 0.84%), Immigrants from Caribbean (12.2%, a difference of 1.1%), and Seminole (11.9%, a difference of 1.3%).
| Demographics | Rating | Rank | Family Poverty |
| Immigrants | Latin America | 0.0 /100 | #304 | Tragic 11.8% |
| Mexicans | 0.0 /100 | #305 | Tragic 11.8% |
| Cajuns | 0.0 /100 | #306 | Tragic 11.9% |
| Immigrants | Congo | 0.0 /100 | #307 | Tragic 11.9% |
| Seminole | 0.0 /100 | #308 | Tragic 11.9% |
| Hispanics or Latinos | 0.0 /100 | #309 | Tragic 12.0% |
| Immigrants | Guatemala | 0.0 /100 | #310 | Tragic 12.0% |
| Ute | 0.0 /100 | #311 | Tragic 12.1% |
| Immigrants | Central America | 0.0 /100 | #312 | Tragic 12.1% |
| Immigrants | Caribbean | 0.0 /100 | #313 | Tragic 12.2% |
| Kiowa | 0.0 /100 | #314 | Tragic 12.2% |
| Immigrants | Mexico | 0.0 /100 | #315 | Tragic 12.3% |
| Hondurans | 0.0 /100 | #316 | Tragic 12.4% |
| Immigrants | Grenada | 0.0 /100 | #317 | Tragic 12.4% |
| U.S. Virgin Islanders | 0.0 /100 | #318 | Tragic 12.4% |
Demographics Similar to Immigrants from South America by Family Poverty
In terms of family poverty, the demographic groups most similar to Immigrants from South America are Aleut (9.5%, a difference of 0.010%), Immigrants from Lebanon (9.4%, a difference of 0.20%), German Russian (9.4%, a difference of 0.30%), Immigrants from Sierra Leone (9.4%, a difference of 0.34%), and Immigrants from Portugal (9.4%, a difference of 0.52%).
| Demographics | Rating | Rank | Family Poverty |
| Spaniards | 22.8 /100 | #199 | Fair 9.4% |
| Immigrants | Costa Rica | 21.7 /100 | #200 | Fair 9.4% |
| Immigrants | Portugal | 20.5 /100 | #201 | Fair 9.4% |
| Immigrants | Sierra Leone | 19.6 /100 | #202 | Poor 9.4% |
| German Russians | 19.4 /100 | #203 | Poor 9.4% |
| Immigrants | Lebanon | 18.9 /100 | #204 | Poor 9.4% |
| Aleuts | 18.0 /100 | #205 | Poor 9.5% |
| Immigrants | South America | 18.0 /100 | #206 | Poor 9.5% |
| Sierra Leoneans | 15.6 /100 | #207 | Poor 9.5% |
| Immigrants | Eastern Africa | 15.1 /100 | #208 | Poor 9.5% |
| Immigrants | Uruguay | 14.0 /100 | #209 | Poor 9.5% |
| Alsatians | 11.3 /100 | #210 | Poor 9.6% |
| Malaysians | 10.6 /100 | #211 | Poor 9.6% |
| Immigrants | Thailand | 9.7 /100 | #212 | Tragic 9.7% |
| Osage | 8.0 /100 | #213 | Tragic 9.7% |