Ute vs Bolivian Family Poverty
COMPARE
Ute
Bolivian
Family Poverty
Family Poverty Comparison
Ute
Bolivians
12.1%
FAMILY POVERTY
0.0/ 100
METRIC RATING
311th/ 347
METRIC RANK
7.5%
FAMILY POVERTY
99.3/ 100
METRIC RATING
38th/ 347
METRIC RANK
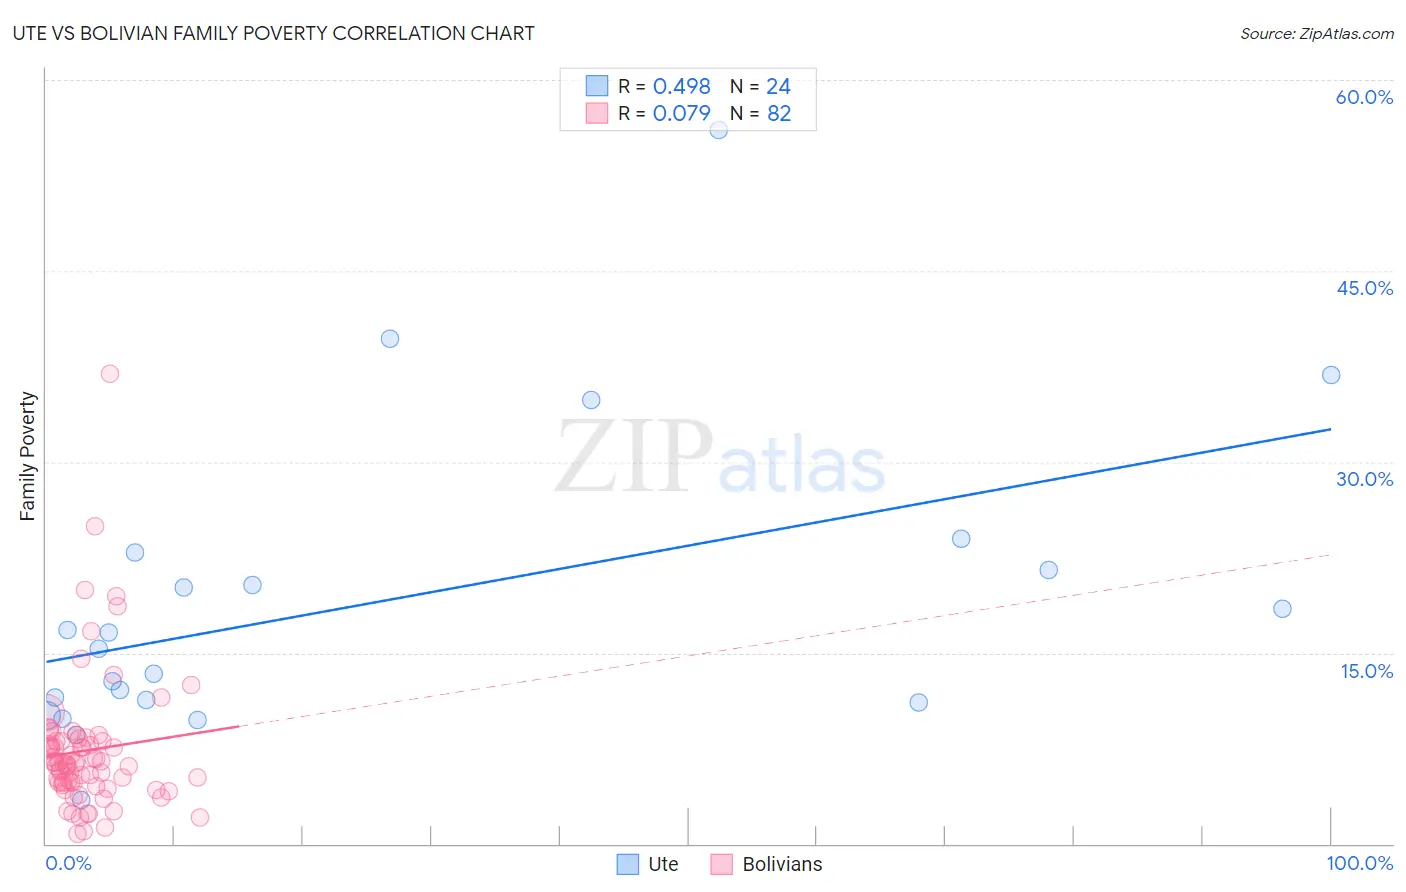
Ute vs Bolivian Family Poverty Correlation Chart
The statistical analysis conducted on geographies consisting of 55,645,170 people shows a moderate positive correlation between the proportion of Ute and poverty level among families in the United States with a correlation coefficient (R) of 0.498 and weighted average of 12.1%. Similarly, the statistical analysis conducted on geographies consisting of 184,453,114 people shows a slight positive correlation between the proportion of Bolivians and poverty level among families in the United States with a correlation coefficient (R) of 0.079 and weighted average of 7.5%, a difference of 59.9%.
Family Poverty Correlation Summary
| Measurement | Ute | Bolivian |
| Minimum | 3.5% | 0.79% |
| Maximum | 56.1% | 36.9% |
| Range | 52.6% | 36.2% |
| Mean | 19.0% | 7.3% |
| Median | 15.9% | 6.3% |
| Interquartile 25% (IQ1) | 11.2% | 4.8% |
| Interquartile 75% (IQ3) | 22.2% | 8.0% |
| Interquartile Range (IQR) | 11.0% | 3.2% |
| Standard Deviation (Sample) | 12.1% | 5.4% |
| Standard Deviation (Population) | 11.8% | 5.4% |
Similar Demographics by Family Poverty
Demographics Similar to Ute by Family Poverty
In terms of family poverty, the demographic groups most similar to Ute are Immigrants from Central America (12.1%, a difference of 0.38%), Hispanic or Latino (12.0%, a difference of 0.84%), Immigrants from Guatemala (12.0%, a difference of 0.84%), Immigrants from Caribbean (12.2%, a difference of 1.1%), and Seminole (11.9%, a difference of 1.3%).
| Demographics | Rating | Rank | Family Poverty |
| Immigrants | Latin America | 0.0 /100 | #304 | Tragic 11.8% |
| Mexicans | 0.0 /100 | #305 | Tragic 11.8% |
| Cajuns | 0.0 /100 | #306 | Tragic 11.9% |
| Immigrants | Congo | 0.0 /100 | #307 | Tragic 11.9% |
| Seminole | 0.0 /100 | #308 | Tragic 11.9% |
| Hispanics or Latinos | 0.0 /100 | #309 | Tragic 12.0% |
| Immigrants | Guatemala | 0.0 /100 | #310 | Tragic 12.0% |
| Ute | 0.0 /100 | #311 | Tragic 12.1% |
| Immigrants | Central America | 0.0 /100 | #312 | Tragic 12.1% |
| Immigrants | Caribbean | 0.0 /100 | #313 | Tragic 12.2% |
| Kiowa | 0.0 /100 | #314 | Tragic 12.2% |
| Immigrants | Mexico | 0.0 /100 | #315 | Tragic 12.3% |
| Hondurans | 0.0 /100 | #316 | Tragic 12.4% |
| Immigrants | Grenada | 0.0 /100 | #317 | Tragic 12.4% |
| U.S. Virgin Islanders | 0.0 /100 | #318 | Tragic 12.4% |
Demographics Similar to Bolivians by Family Poverty
In terms of family poverty, the demographic groups most similar to Bolivians are Carpatho Rusyn (7.5%, a difference of 0.060%), Slovene (7.5%, a difference of 0.10%), Estonian (7.5%, a difference of 0.24%), Immigrants from Australia (7.6%, a difference of 0.40%), and Turkish (7.5%, a difference of 0.41%).
| Demographics | Rating | Rank | Family Poverty |
| Czechs | 99.6 /100 | #31 | Exceptional 7.4% |
| Poles | 99.5 /100 | #32 | Exceptional 7.4% |
| Immigrants | Japan | 99.5 /100 | #33 | Exceptional 7.4% |
| Russians | 99.5 /100 | #34 | Exceptional 7.5% |
| Greeks | 99.4 /100 | #35 | Exceptional 7.5% |
| Turks | 99.4 /100 | #36 | Exceptional 7.5% |
| Estonians | 99.4 /100 | #37 | Exceptional 7.5% |
| Bolivians | 99.3 /100 | #38 | Exceptional 7.5% |
| Carpatho Rusyns | 99.3 /100 | #39 | Exceptional 7.5% |
| Slovenes | 99.3 /100 | #40 | Exceptional 7.5% |
| Immigrants | Australia | 99.2 /100 | #41 | Exceptional 7.6% |
| Scandinavians | 99.1 /100 | #42 | Exceptional 7.6% |
| Immigrants | Austria | 99.1 /100 | #43 | Exceptional 7.6% |
| Germans | 99.0 /100 | #44 | Exceptional 7.7% |
| Okinawans | 98.9 /100 | #45 | Exceptional 7.7% |