Irish vs West Indian Family Poverty
COMPARE
Irish
West Indian
Family Poverty
Family Poverty Comparison
Irish
West Indians
7.9%
FAMILY POVERTY
97.8/ 100
METRIC RATING
81st/ 347
METRIC RANK
11.5%
FAMILY POVERTY
0.0/ 100
METRIC RATING
290th/ 347
METRIC RANK
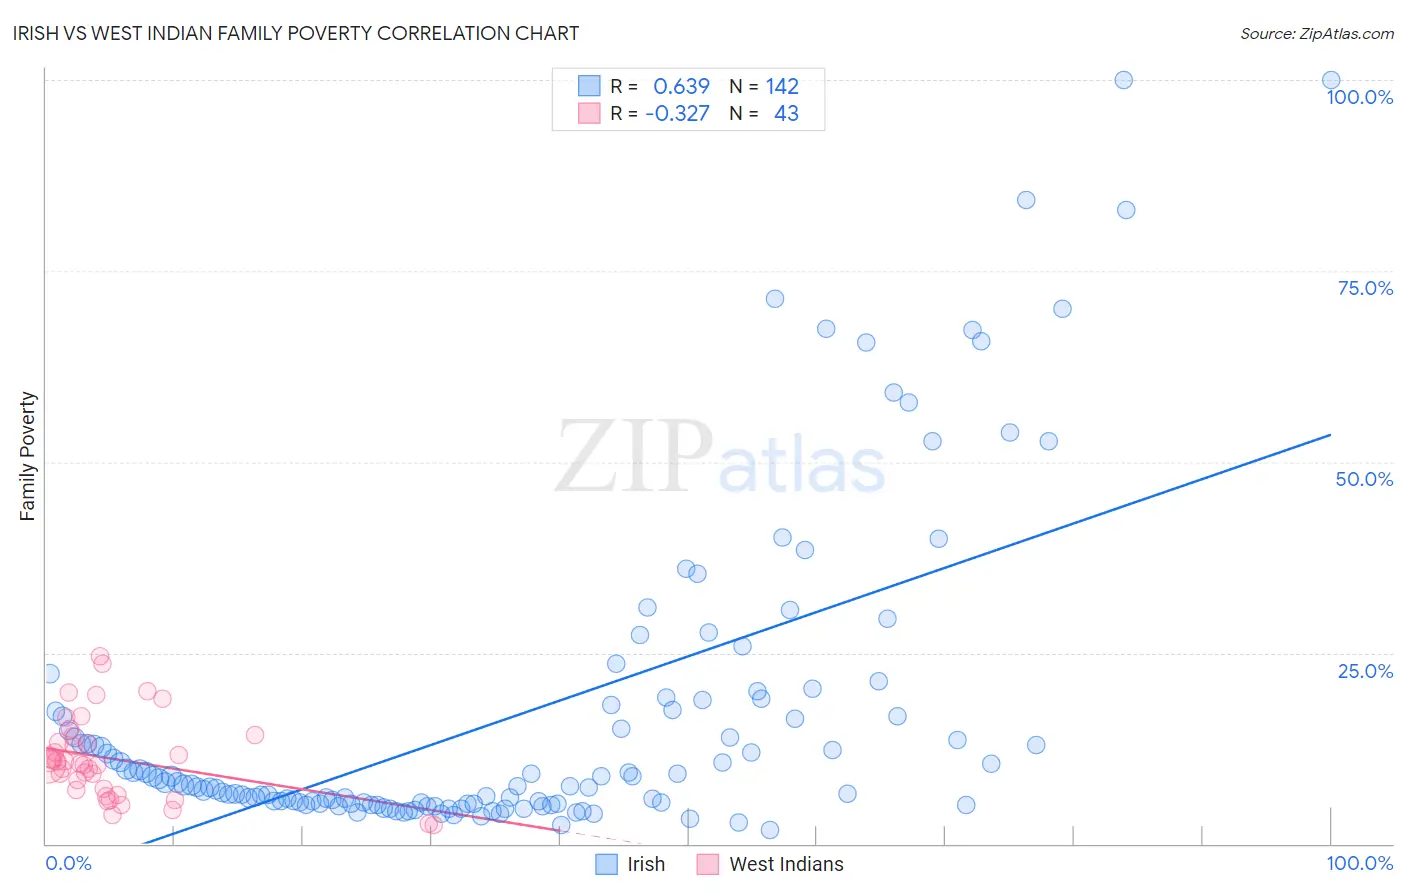
Irish vs West Indian Family Poverty Correlation Chart
The statistical analysis conducted on geographies consisting of 574,608,080 people shows a significant positive correlation between the proportion of Irish and poverty level among families in the United States with a correlation coefficient (R) of 0.639 and weighted average of 7.9%. Similarly, the statistical analysis conducted on geographies consisting of 253,611,735 people shows a mild negative correlation between the proportion of West Indians and poverty level among families in the United States with a correlation coefficient (R) of -0.327 and weighted average of 11.5%, a difference of 46.1%.
Family Poverty Correlation Summary
| Measurement | Irish | West Indian |
| Minimum | 1.7% | 2.5% |
| Maximum | 100.0% | 24.5% |
| Range | 98.3% | 22.0% |
| Mean | 16.9% | 11.2% |
| Median | 7.9% | 10.5% |
| Interquartile 25% (IQ1) | 5.2% | 7.1% |
| Interquartile 75% (IQ3) | 17.5% | 14.0% |
| Interquartile Range (IQR) | 12.2% | 6.9% |
| Standard Deviation (Sample) | 20.6% | 5.3% |
| Standard Deviation (Population) | 20.5% | 5.3% |
Similar Demographics by Family Poverty
Demographics Similar to Irish by Family Poverty
In terms of family poverty, the demographic groups most similar to Irish are English (7.9%, a difference of 0.010%), Immigrants from Poland (7.9%, a difference of 0.030%), Immigrants from Europe (7.9%, a difference of 0.070%), Immigrants from North America (7.9%, a difference of 0.15%), and Slovak (7.9%, a difference of 0.20%).
| Demographics | Rating | Rank | Family Poverty |
| Immigrants | China | 98.1 /100 | #74 | Exceptional 7.8% |
| Immigrants | Croatia | 98.1 /100 | #75 | Exceptional 7.8% |
| Immigrants | Latvia | 98.0 /100 | #76 | Exceptional 7.9% |
| Ukrainians | 98.0 /100 | #77 | Exceptional 7.9% |
| Immigrants | North America | 97.9 /100 | #78 | Exceptional 7.9% |
| Immigrants | Europe | 97.8 /100 | #79 | Exceptional 7.9% |
| English | 97.8 /100 | #80 | Exceptional 7.9% |
| Irish | 97.8 /100 | #81 | Exceptional 7.9% |
| Immigrants | Poland | 97.8 /100 | #82 | Exceptional 7.9% |
| Slovaks | 97.7 /100 | #83 | Exceptional 7.9% |
| British | 97.5 /100 | #84 | Exceptional 7.9% |
| Immigrants | Asia | 97.4 /100 | #85 | Exceptional 7.9% |
| Scottish | 97.3 /100 | #86 | Exceptional 7.9% |
| Belgians | 97.3 /100 | #87 | Exceptional 8.0% |
| Serbians | 97.2 /100 | #88 | Exceptional 8.0% |
Demographics Similar to West Indians by Family Poverty
In terms of family poverty, the demographic groups most similar to West Indians are Immigrants from Barbados (11.5%, a difference of 0.010%), Immigrants from Belize (11.5%, a difference of 0.060%), Haitian (11.5%, a difference of 0.060%), Immigrants from Somalia (11.5%, a difference of 0.17%), and Vietnamese (11.5%, a difference of 0.25%).
| Demographics | Rating | Rank | Family Poverty |
| Indonesians | 0.0 /100 | #283 | Tragic 11.3% |
| Yaqui | 0.0 /100 | #284 | Tragic 11.3% |
| Barbadians | 0.0 /100 | #285 | Tragic 11.3% |
| Senegalese | 0.0 /100 | #286 | Tragic 11.5% |
| Vietnamese | 0.0 /100 | #287 | Tragic 11.5% |
| Immigrants | Belize | 0.0 /100 | #288 | Tragic 11.5% |
| Immigrants | Barbados | 0.0 /100 | #289 | Tragic 11.5% |
| West Indians | 0.0 /100 | #290 | Tragic 11.5% |
| Haitians | 0.0 /100 | #291 | Tragic 11.5% |
| Immigrants | Somalia | 0.0 /100 | #292 | Tragic 11.5% |
| Immigrants | Cabo Verde | 0.0 /100 | #293 | Tragic 11.6% |
| Immigrants | St. Vincent and the Grenadines | 0.0 /100 | #294 | Tragic 11.6% |
| Immigrants | Haiti | 0.0 /100 | #295 | Tragic 11.6% |
| Choctaw | 0.0 /100 | #296 | Tragic 11.6% |
| Creek | 0.0 /100 | #297 | Tragic 11.7% |