Canadian vs West Indian Family Poverty
COMPARE
Canadian
West Indian
Family Poverty
Family Poverty Comparison
Canadians
West Indians
8.2%
FAMILY POVERTY
94.2/ 100
METRIC RATING
113th/ 347
METRIC RANK
11.5%
FAMILY POVERTY
0.0/ 100
METRIC RATING
290th/ 347
METRIC RANK
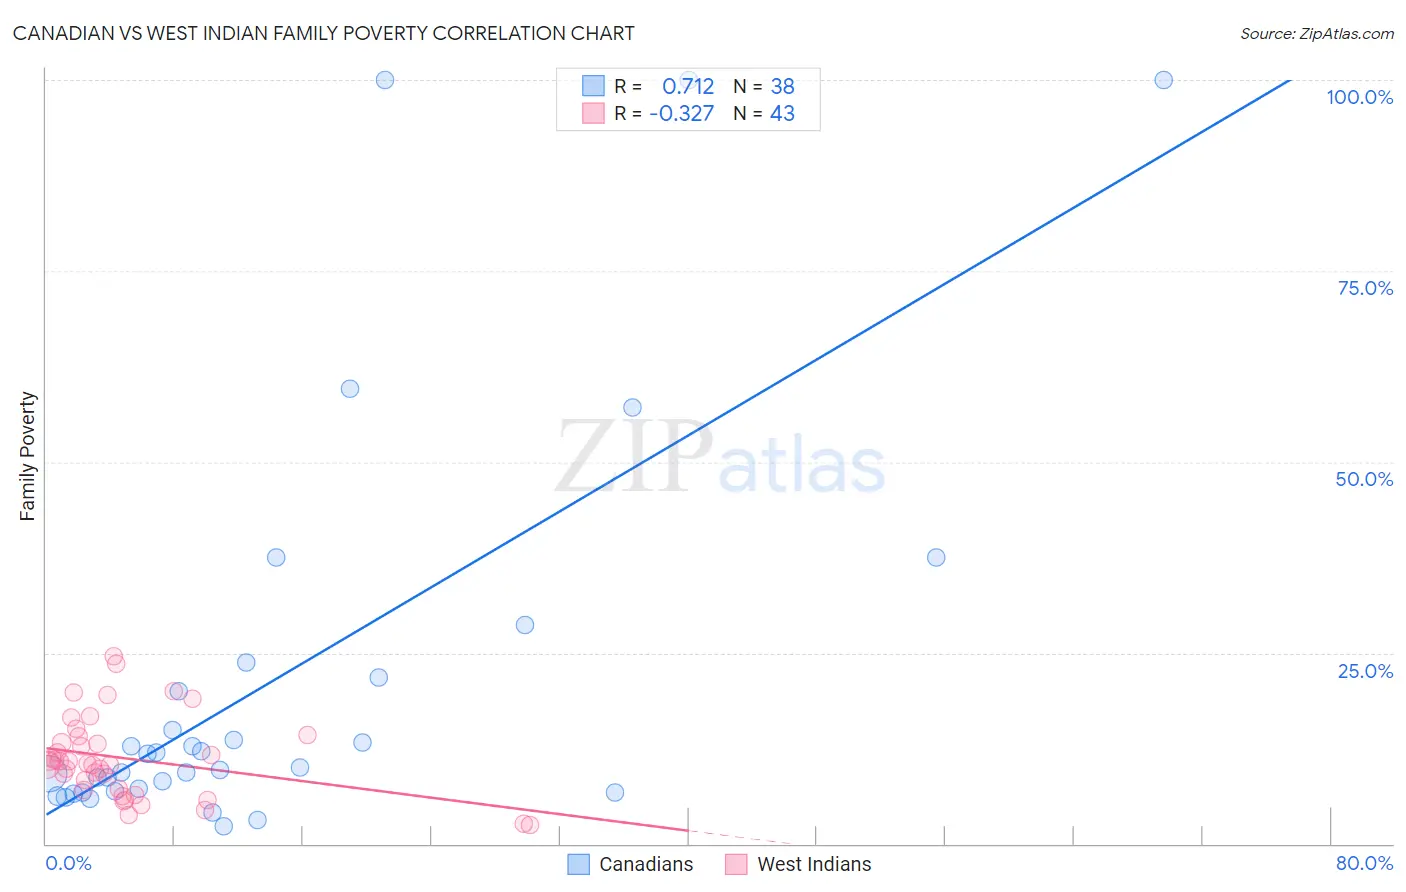
Canadian vs West Indian Family Poverty Correlation Chart
The statistical analysis conducted on geographies consisting of 435,772,566 people shows a strong positive correlation between the proportion of Canadians and poverty level among families in the United States with a correlation coefficient (R) of 0.712 and weighted average of 8.2%. Similarly, the statistical analysis conducted on geographies consisting of 253,611,735 people shows a mild negative correlation between the proportion of West Indians and poverty level among families in the United States with a correlation coefficient (R) of -0.327 and weighted average of 11.5%, a difference of 40.8%.
Family Poverty Correlation Summary
| Measurement | Canadian | West Indian |
| Minimum | 2.3% | 2.5% |
| Maximum | 100.0% | 24.5% |
| Range | 97.7% | 22.0% |
| Mean | 21.7% | 11.2% |
| Median | 10.9% | 10.5% |
| Interquartile 25% (IQ1) | 6.9% | 7.1% |
| Interquartile 75% (IQ3) | 21.7% | 14.0% |
| Interquartile Range (IQR) | 14.9% | 6.9% |
| Standard Deviation (Sample) | 26.7% | 5.3% |
| Standard Deviation (Population) | 26.4% | 5.3% |
Similar Demographics by Family Poverty
Demographics Similar to Canadians by Family Poverty
In terms of family poverty, the demographic groups most similar to Canadians are Immigrants from Zimbabwe (8.2%, a difference of 0.090%), Immigrants from France (8.2%, a difference of 0.17%), Taiwanese (8.2%, a difference of 0.28%), Romanian (8.2%, a difference of 0.33%), and Jordanian (8.2%, a difference of 0.42%).
| Demographics | Rating | Rank | Family Poverty |
| Egyptians | 95.1 /100 | #106 | Exceptional 8.1% |
| French Canadians | 95.0 /100 | #107 | Exceptional 8.1% |
| Basques | 94.9 /100 | #108 | Exceptional 8.1% |
| Jordanians | 94.8 /100 | #109 | Exceptional 8.2% |
| Romanians | 94.7 /100 | #110 | Exceptional 8.2% |
| Taiwanese | 94.6 /100 | #111 | Exceptional 8.2% |
| Immigrants | France | 94.4 /100 | #112 | Exceptional 8.2% |
| Canadians | 94.2 /100 | #113 | Exceptional 8.2% |
| Immigrants | Zimbabwe | 94.0 /100 | #114 | Exceptional 8.2% |
| Immigrants | Israel | 93.5 /100 | #115 | Exceptional 8.2% |
| South Africans | 93.4 /100 | #116 | Exceptional 8.2% |
| Immigrants | Russia | 93.2 /100 | #117 | Exceptional 8.2% |
| Immigrants | Western Europe | 92.9 /100 | #118 | Exceptional 8.2% |
| French | 92.8 /100 | #119 | Exceptional 8.3% |
| Immigrants | Egypt | 91.6 /100 | #120 | Exceptional 8.3% |
Demographics Similar to West Indians by Family Poverty
In terms of family poverty, the demographic groups most similar to West Indians are Immigrants from Barbados (11.5%, a difference of 0.010%), Immigrants from Belize (11.5%, a difference of 0.060%), Haitian (11.5%, a difference of 0.060%), Immigrants from Somalia (11.5%, a difference of 0.17%), and Vietnamese (11.5%, a difference of 0.25%).
| Demographics | Rating | Rank | Family Poverty |
| Indonesians | 0.0 /100 | #283 | Tragic 11.3% |
| Yaqui | 0.0 /100 | #284 | Tragic 11.3% |
| Barbadians | 0.0 /100 | #285 | Tragic 11.3% |
| Senegalese | 0.0 /100 | #286 | Tragic 11.5% |
| Vietnamese | 0.0 /100 | #287 | Tragic 11.5% |
| Immigrants | Belize | 0.0 /100 | #288 | Tragic 11.5% |
| Immigrants | Barbados | 0.0 /100 | #289 | Tragic 11.5% |
| West Indians | 0.0 /100 | #290 | Tragic 11.5% |
| Haitians | 0.0 /100 | #291 | Tragic 11.5% |
| Immigrants | Somalia | 0.0 /100 | #292 | Tragic 11.5% |
| Immigrants | Cabo Verde | 0.0 /100 | #293 | Tragic 11.6% |
| Immigrants | St. Vincent and the Grenadines | 0.0 /100 | #294 | Tragic 11.6% |
| Immigrants | Haiti | 0.0 /100 | #295 | Tragic 11.6% |
| Choctaw | 0.0 /100 | #296 | Tragic 11.6% |
| Creek | 0.0 /100 | #297 | Tragic 11.7% |