Turkish vs Immigrants from Jordan Receiving Food Stamps
COMPARE
Turkish
Immigrants from Jordan
Receiving Food Stamps
Receiving Food Stamps Comparison
Turks
Immigrants from Jordan
9.5%
RECEIVING FOOD STAMPS
99.6/ 100
METRIC RATING
34th/ 347
METRIC RANK
10.7%
RECEIVING FOOD STAMPS
92.5/ 100
METRIC RATING
128th/ 347
METRIC RANK
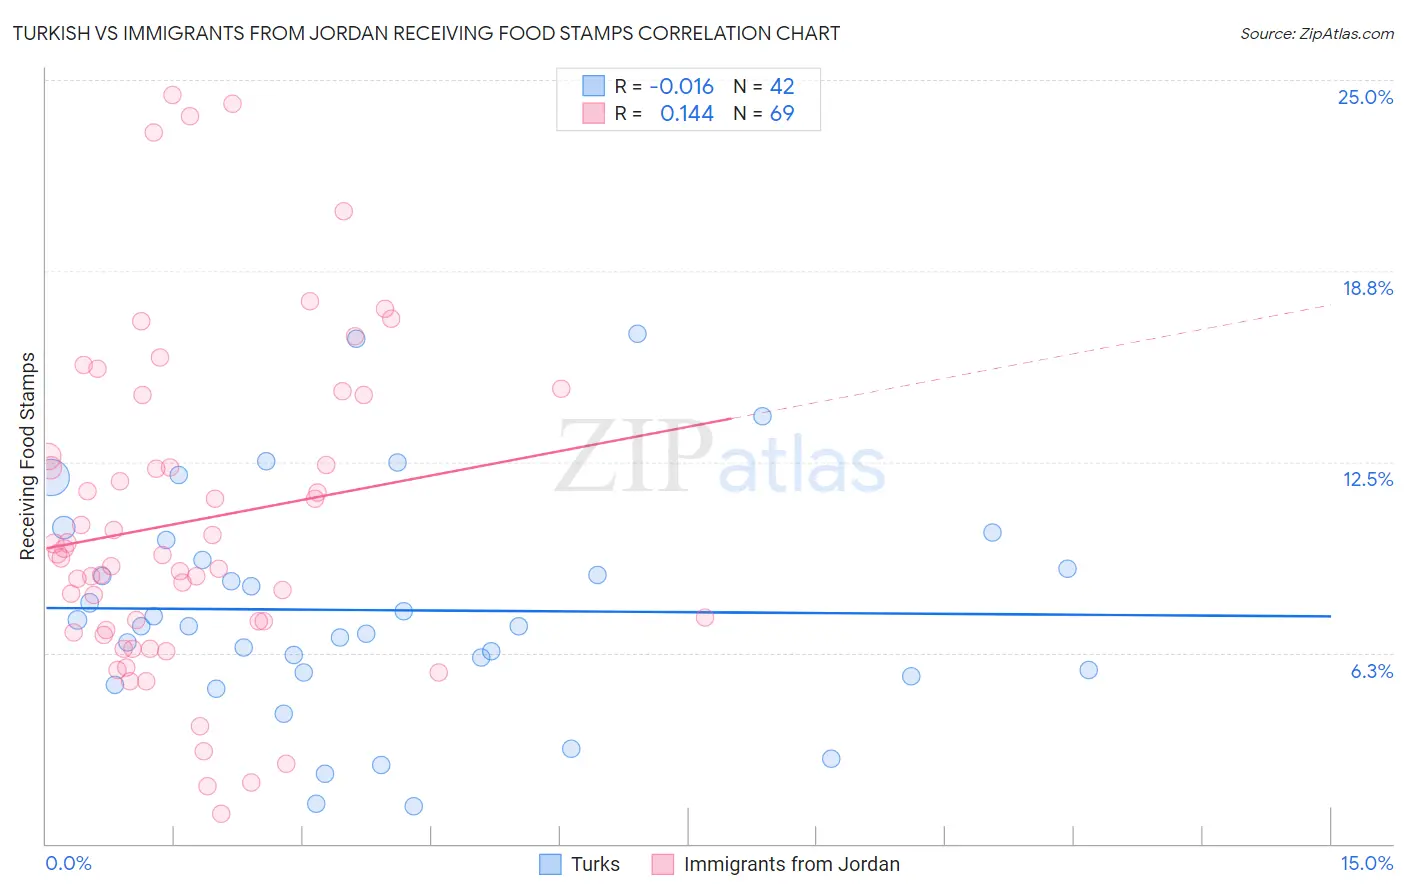
Turkish vs Immigrants from Jordan Receiving Food Stamps Correlation Chart
The statistical analysis conducted on geographies consisting of 271,161,413 people shows no correlation between the proportion of Turks and percentage of population receiving government assistance and/or food stamps in the United States with a correlation coefficient (R) of -0.016 and weighted average of 9.5%. Similarly, the statistical analysis conducted on geographies consisting of 181,094,719 people shows a poor positive correlation between the proportion of Immigrants from Jordan and percentage of population receiving government assistance and/or food stamps in the United States with a correlation coefficient (R) of 0.144 and weighted average of 10.7%, a difference of 12.9%.
Receiving Food Stamps Correlation Summary
| Measurement | Turkish | Immigrants from Jordan |
| Minimum | 1.2% | 1.0% |
| Maximum | 16.7% | 24.5% |
| Range | 15.5% | 23.5% |
| Mean | 7.6% | 10.6% |
| Median | 7.1% | 9.5% |
| Interquartile 25% (IQ1) | 5.6% | 7.0% |
| Interquartile 75% (IQ3) | 9.3% | 13.7% |
| Interquartile Range (IQR) | 3.7% | 6.7% |
| Standard Deviation (Sample) | 3.6% | 5.3% |
| Standard Deviation (Population) | 3.6% | 5.3% |
Similar Demographics by Receiving Food Stamps
Demographics Similar to Turks by Receiving Food Stamps
In terms of receiving food stamps, the demographic groups most similar to Turks are Zimbabwean (9.5%, a difference of 0.010%), Immigrants from Austria (9.5%, a difference of 0.030%), Estonian (9.5%, a difference of 0.050%), European (9.5%, a difference of 0.12%), and Immigrants from Sri Lanka (9.5%, a difference of 0.41%).
| Demographics | Rating | Rank | Receiving Food Stamps |
| Bhutanese | 99.8 /100 | #27 | Exceptional 9.2% |
| Czechs | 99.8 /100 | #28 | Exceptional 9.2% |
| Immigrants | Lithuania | 99.8 /100 | #29 | Exceptional 9.2% |
| Immigrants | Sweden | 99.7 /100 | #30 | Exceptional 9.3% |
| Immigrants | Eastern Asia | 99.7 /100 | #31 | Exceptional 9.3% |
| Bolivians | 99.7 /100 | #32 | Exceptional 9.3% |
| Zimbabweans | 99.6 /100 | #33 | Exceptional 9.5% |
| Turks | 99.6 /100 | #34 | Exceptional 9.5% |
| Immigrants | Austria | 99.6 /100 | #35 | Exceptional 9.5% |
| Estonians | 99.6 /100 | #36 | Exceptional 9.5% |
| Europeans | 99.6 /100 | #37 | Exceptional 9.5% |
| Immigrants | Sri Lanka | 99.5 /100 | #38 | Exceptional 9.5% |
| Immigrants | Bolivia | 99.5 /100 | #39 | Exceptional 9.5% |
| Immigrants | Netherlands | 99.5 /100 | #40 | Exceptional 9.5% |
| Cambodians | 99.5 /100 | #41 | Exceptional 9.5% |
Demographics Similar to Immigrants from Jordan by Receiving Food Stamps
In terms of receiving food stamps, the demographic groups most similar to Immigrants from Jordan are Yugoslavian (10.7%, a difference of 0.0%), Immigrants from Ethiopia (10.7%, a difference of 0.010%), Afghan (10.7%, a difference of 0.030%), Israeli (10.7%, a difference of 0.10%), and French (10.7%, a difference of 0.10%).
| Demographics | Rating | Rank | Receiving Food Stamps |
| Slavs | 93.8 /100 | #121 | Exceptional 10.6% |
| Sri Lankans | 93.7 /100 | #122 | Exceptional 10.6% |
| Immigrants | Philippines | 93.3 /100 | #123 | Exceptional 10.7% |
| Paraguayans | 93.0 /100 | #124 | Exceptional 10.7% |
| Ukrainians | 92.8 /100 | #125 | Exceptional 10.7% |
| Afghans | 92.6 /100 | #126 | Exceptional 10.7% |
| Immigrants | Ethiopia | 92.6 /100 | #127 | Exceptional 10.7% |
| Immigrants | Jordan | 92.5 /100 | #128 | Exceptional 10.7% |
| Yugoslavians | 92.5 /100 | #129 | Exceptional 10.7% |
| Israelis | 92.4 /100 | #130 | Exceptional 10.7% |
| French | 92.3 /100 | #131 | Exceptional 10.7% |
| Immigrants | Germany | 92.0 /100 | #132 | Exceptional 10.7% |
| Immigrants | Russia | 90.9 /100 | #133 | Exceptional 10.8% |
| Immigrants | Brazil | 90.3 /100 | #134 | Exceptional 10.8% |
| Argentineans | 90.2 /100 | #135 | Exceptional 10.8% |