Turkish vs Immigrants from Jordan Female Poverty Among 25-34 Year Olds
COMPARE
Turkish
Immigrants from Jordan
Female Poverty Among 25-34 Year Olds
Female Poverty Among 25-34 Year Olds Comparison
Turks
Immigrants from Jordan
11.4%
FEMALE POVERTY AMONG 25-34 YEAR OLDS
100.0/ 100
METRIC RATING
21st/ 347
METRIC RANK
12.4%
FEMALE POVERTY AMONG 25-34 YEAR OLDS
98.5/ 100
METRIC RATING
79th/ 347
METRIC RANK
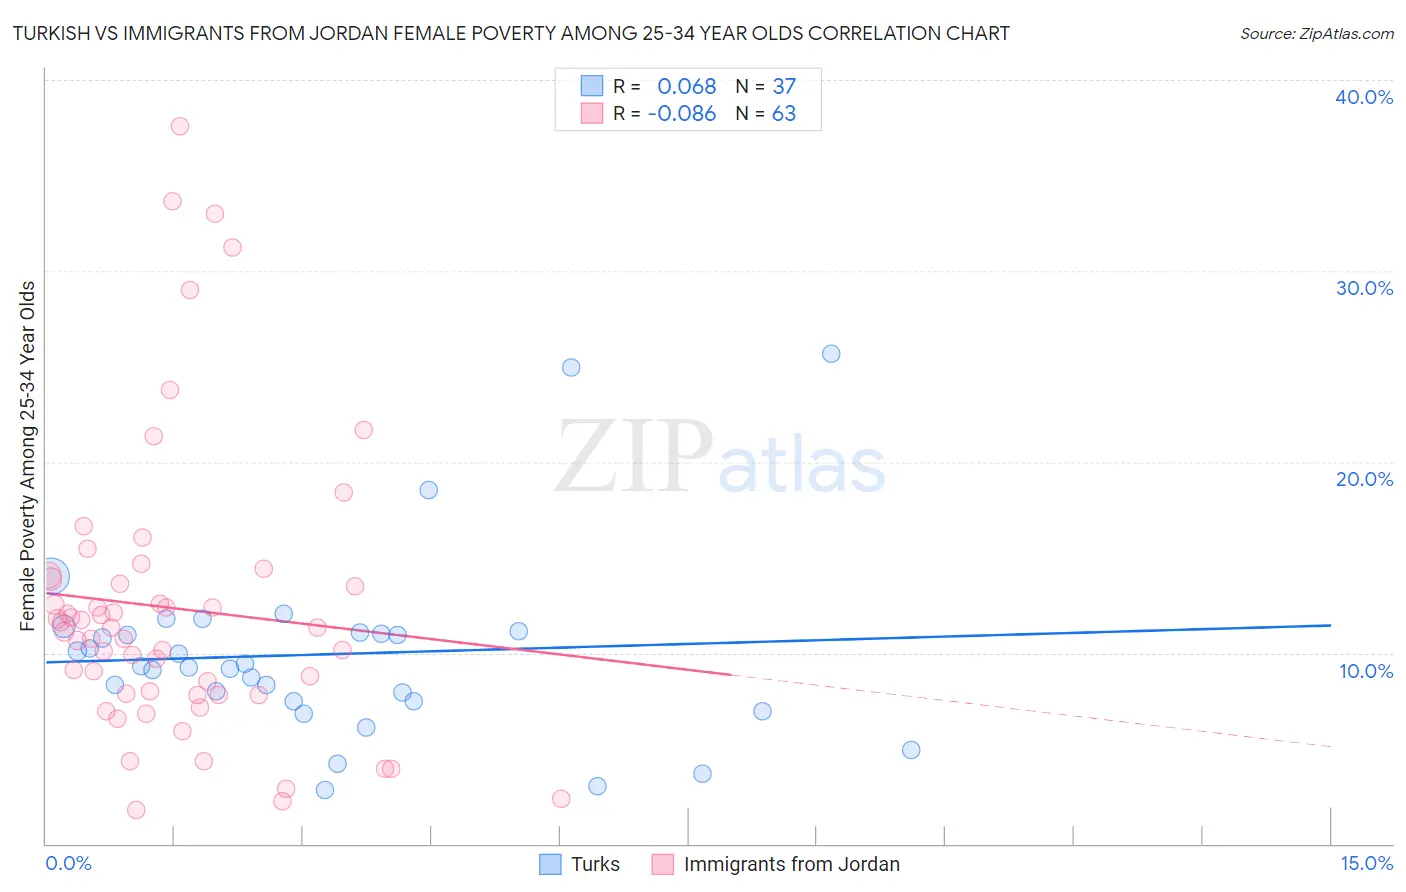
Turkish vs Immigrants from Jordan Female Poverty Among 25-34 Year Olds Correlation Chart
The statistical analysis conducted on geographies consisting of 268,457,776 people shows a slight positive correlation between the proportion of Turks and poverty level among females between the ages 25 and 34 in the United States with a correlation coefficient (R) of 0.068 and weighted average of 11.4%. Similarly, the statistical analysis conducted on geographies consisting of 180,469,872 people shows a slight negative correlation between the proportion of Immigrants from Jordan and poverty level among females between the ages 25 and 34 in the United States with a correlation coefficient (R) of -0.086 and weighted average of 12.4%, a difference of 8.5%.
Female Poverty Among 25-34 Year Olds Correlation Summary
| Measurement | Turkish | Immigrants from Jordan |
| Minimum | 2.8% | 1.8% |
| Maximum | 25.6% | 37.6% |
| Range | 22.8% | 35.8% |
| Mean | 9.9% | 12.3% |
| Median | 9.3% | 11.3% |
| Interquartile 25% (IQ1) | 7.5% | 7.8% |
| Interquartile 75% (IQ3) | 11.1% | 13.9% |
| Interquartile Range (IQR) | 3.6% | 6.1% |
| Standard Deviation (Sample) | 4.8% | 7.6% |
| Standard Deviation (Population) | 4.8% | 7.5% |
Similar Demographics by Female Poverty Among 25-34 Year Olds
Demographics Similar to Turks by Female Poverty Among 25-34 Year Olds
In terms of female poverty among 25-34 year olds, the demographic groups most similar to Turks are Asian (11.4%, a difference of 0.15%), Bolivian (11.4%, a difference of 0.21%), Maltese (11.4%, a difference of 0.24%), Bhutanese (11.4%, a difference of 0.46%), and Tongan (11.5%, a difference of 0.61%).
| Demographics | Rating | Rank | Female Poverty Among 25-34 Year Olds |
| Indians (Asian) | 100.0 /100 | #14 | Exceptional 11.2% |
| Assyrians/Chaldeans/Syriacs | 100.0 /100 | #15 | Exceptional 11.2% |
| Immigrants | Bolivia | 100.0 /100 | #16 | Exceptional 11.2% |
| Immigrants | China | 100.0 /100 | #17 | Exceptional 11.2% |
| Immigrants | Eastern Asia | 100.0 /100 | #18 | Exceptional 11.2% |
| Iranians | 100.0 /100 | #19 | Exceptional 11.2% |
| Okinawans | 100.0 /100 | #20 | Exceptional 11.3% |
| Turks | 100.0 /100 | #21 | Exceptional 11.4% |
| Asians | 99.9 /100 | #22 | Exceptional 11.4% |
| Bolivians | 99.9 /100 | #23 | Exceptional 11.4% |
| Maltese | 99.9 /100 | #24 | Exceptional 11.4% |
| Bhutanese | 99.9 /100 | #25 | Exceptional 11.4% |
| Tongans | 99.9 /100 | #26 | Exceptional 11.5% |
| Immigrants | Greece | 99.9 /100 | #27 | Exceptional 11.5% |
| Immigrants | Pakistan | 99.9 /100 | #28 | Exceptional 11.5% |
Demographics Similar to Immigrants from Jordan by Female Poverty Among 25-34 Year Olds
In terms of female poverty among 25-34 year olds, the demographic groups most similar to Immigrants from Jordan are Immigrants from Ukraine (12.3%, a difference of 0.27%), Immigrants from Malaysia (12.4%, a difference of 0.27%), Immigrants from Italy (12.3%, a difference of 0.50%), Immigrants from Kazakhstan (12.4%, a difference of 0.51%), and Ethiopian (12.4%, a difference of 0.59%).
| Demographics | Rating | Rank | Female Poverty Among 25-34 Year Olds |
| Lithuanians | 99.1 /100 | #72 | Exceptional 12.2% |
| Immigrants | Vietnam | 98.9 /100 | #73 | Exceptional 12.3% |
| Immigrants | Sweden | 98.9 /100 | #74 | Exceptional 12.3% |
| Estonians | 98.9 /100 | #75 | Exceptional 12.3% |
| Greeks | 98.9 /100 | #76 | Exceptional 12.3% |
| Immigrants | Italy | 98.8 /100 | #77 | Exceptional 12.3% |
| Immigrants | Ukraine | 98.6 /100 | #78 | Exceptional 12.3% |
| Immigrants | Jordan | 98.5 /100 | #79 | Exceptional 12.4% |
| Immigrants | Malaysia | 98.3 /100 | #80 | Exceptional 12.4% |
| Immigrants | Kazakhstan | 98.1 /100 | #81 | Exceptional 12.4% |
| Ethiopians | 98.0 /100 | #82 | Exceptional 12.4% |
| Albanians | 97.7 /100 | #83 | Exceptional 12.5% |
| Immigrants | Latvia | 97.7 /100 | #84 | Exceptional 12.5% |
| Immigrants | South Eastern Asia | 97.6 /100 | #85 | Exceptional 12.5% |
| Croatians | 97.5 /100 | #86 | Exceptional 12.5% |