Turkish vs Portuguese Receiving Food Stamps
COMPARE
Turkish
Portuguese
Receiving Food Stamps
Receiving Food Stamps Comparison
Turks
Portuguese
9.5%
RECEIVING FOOD STAMPS
99.6/ 100
METRIC RATING
34th/ 347
METRIC RANK
12.2%
RECEIVING FOOD STAMPS
25.1/ 100
METRIC RATING
199th/ 347
METRIC RANK
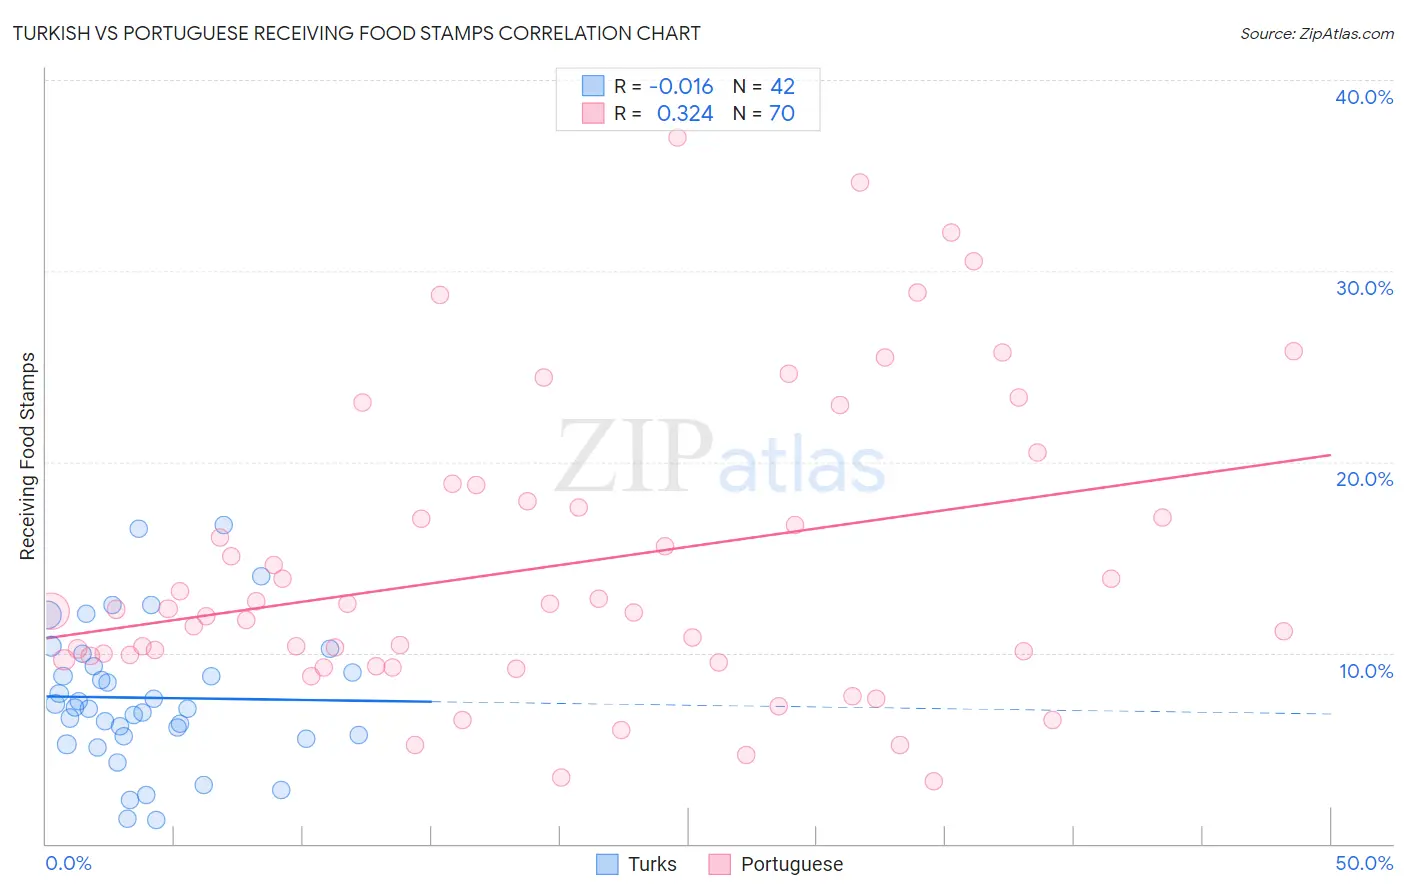
Turkish vs Portuguese Receiving Food Stamps Correlation Chart
The statistical analysis conducted on geographies consisting of 271,161,413 people shows no correlation between the proportion of Turks and percentage of population receiving government assistance and/or food stamps in the United States with a correlation coefficient (R) of -0.016 and weighted average of 9.5%. Similarly, the statistical analysis conducted on geographies consisting of 448,612,640 people shows a mild positive correlation between the proportion of Portuguese and percentage of population receiving government assistance and/or food stamps in the United States with a correlation coefficient (R) of 0.324 and weighted average of 12.2%, a difference of 28.5%.
Receiving Food Stamps Correlation Summary
| Measurement | Turkish | Portuguese |
| Minimum | 1.2% | 3.3% |
| Maximum | 16.7% | 37.0% |
| Range | 15.5% | 33.7% |
| Mean | 7.6% | 14.6% |
| Median | 7.1% | 12.2% |
| Interquartile 25% (IQ1) | 5.6% | 9.6% |
| Interquartile 75% (IQ3) | 9.3% | 17.9% |
| Interquartile Range (IQR) | 3.7% | 8.3% |
| Standard Deviation (Sample) | 3.6% | 7.7% |
| Standard Deviation (Population) | 3.6% | 7.7% |
Similar Demographics by Receiving Food Stamps
Demographics Similar to Turks by Receiving Food Stamps
In terms of receiving food stamps, the demographic groups most similar to Turks are Zimbabwean (9.5%, a difference of 0.010%), Immigrants from Austria (9.5%, a difference of 0.030%), Estonian (9.5%, a difference of 0.050%), European (9.5%, a difference of 0.12%), and Immigrants from Sri Lanka (9.5%, a difference of 0.41%).
| Demographics | Rating | Rank | Receiving Food Stamps |
| Bhutanese | 99.8 /100 | #27 | Exceptional 9.2% |
| Czechs | 99.8 /100 | #28 | Exceptional 9.2% |
| Immigrants | Lithuania | 99.8 /100 | #29 | Exceptional 9.2% |
| Immigrants | Sweden | 99.7 /100 | #30 | Exceptional 9.3% |
| Immigrants | Eastern Asia | 99.7 /100 | #31 | Exceptional 9.3% |
| Bolivians | 99.7 /100 | #32 | Exceptional 9.3% |
| Zimbabweans | 99.6 /100 | #33 | Exceptional 9.5% |
| Turks | 99.6 /100 | #34 | Exceptional 9.5% |
| Immigrants | Austria | 99.6 /100 | #35 | Exceptional 9.5% |
| Estonians | 99.6 /100 | #36 | Exceptional 9.5% |
| Europeans | 99.6 /100 | #37 | Exceptional 9.5% |
| Immigrants | Sri Lanka | 99.5 /100 | #38 | Exceptional 9.5% |
| Immigrants | Bolivia | 99.5 /100 | #39 | Exceptional 9.5% |
| Immigrants | Netherlands | 99.5 /100 | #40 | Exceptional 9.5% |
| Cambodians | 99.5 /100 | #41 | Exceptional 9.5% |
Demographics Similar to Portuguese by Receiving Food Stamps
In terms of receiving food stamps, the demographic groups most similar to Portuguese are Immigrants from Costa Rica (12.2%, a difference of 0.050%), Delaware (12.2%, a difference of 0.18%), Iraqi (12.2%, a difference of 0.26%), Sierra Leonean (12.2%, a difference of 0.28%), and American (12.2%, a difference of 0.29%).
| Demographics | Rating | Rank | Receiving Food Stamps |
| Samoans | 31.0 /100 | #192 | Fair 12.1% |
| Immigrants | Fiji | 27.8 /100 | #193 | Fair 12.1% |
| Immigrants | Sudan | 27.1 /100 | #194 | Fair 12.1% |
| Americans | 26.7 /100 | #195 | Fair 12.2% |
| Iraqis | 26.6 /100 | #196 | Fair 12.2% |
| Delaware | 26.1 /100 | #197 | Fair 12.2% |
| Immigrants | Costa Rica | 25.4 /100 | #198 | Fair 12.2% |
| Portuguese | 25.1 /100 | #199 | Fair 12.2% |
| Sierra Leoneans | 23.6 /100 | #200 | Fair 12.2% |
| Ugandans | 22.5 /100 | #201 | Fair 12.2% |
| Immigrants | Venezuela | 20.1 /100 | #202 | Fair 12.3% |
| Shoshone | 17.7 /100 | #203 | Poor 12.4% |
| Immigrants | Nonimmigrants | 17.6 /100 | #204 | Poor 12.4% |
| Aleuts | 17.3 /100 | #205 | Poor 12.4% |
| Immigrants | Thailand | 17.0 /100 | #206 | Poor 12.4% |