Scotch-Irish vs Japanese Child Poverty Among Girls Under 16
COMPARE
Scotch-Irish
Japanese
Child Poverty Among Girls Under 16
Child Poverty Among Girls Under 16 Comparison
Scotch-Irish
Japanese
16.7%
CHILD POVERTY AMONG GIRLS UNDER 16
39.6/ 100
METRIC RATING
184th/ 347
METRIC RANK
17.8%
CHILD POVERTY AMONG GIRLS UNDER 16
5.3/ 100
METRIC RATING
217th/ 347
METRIC RANK
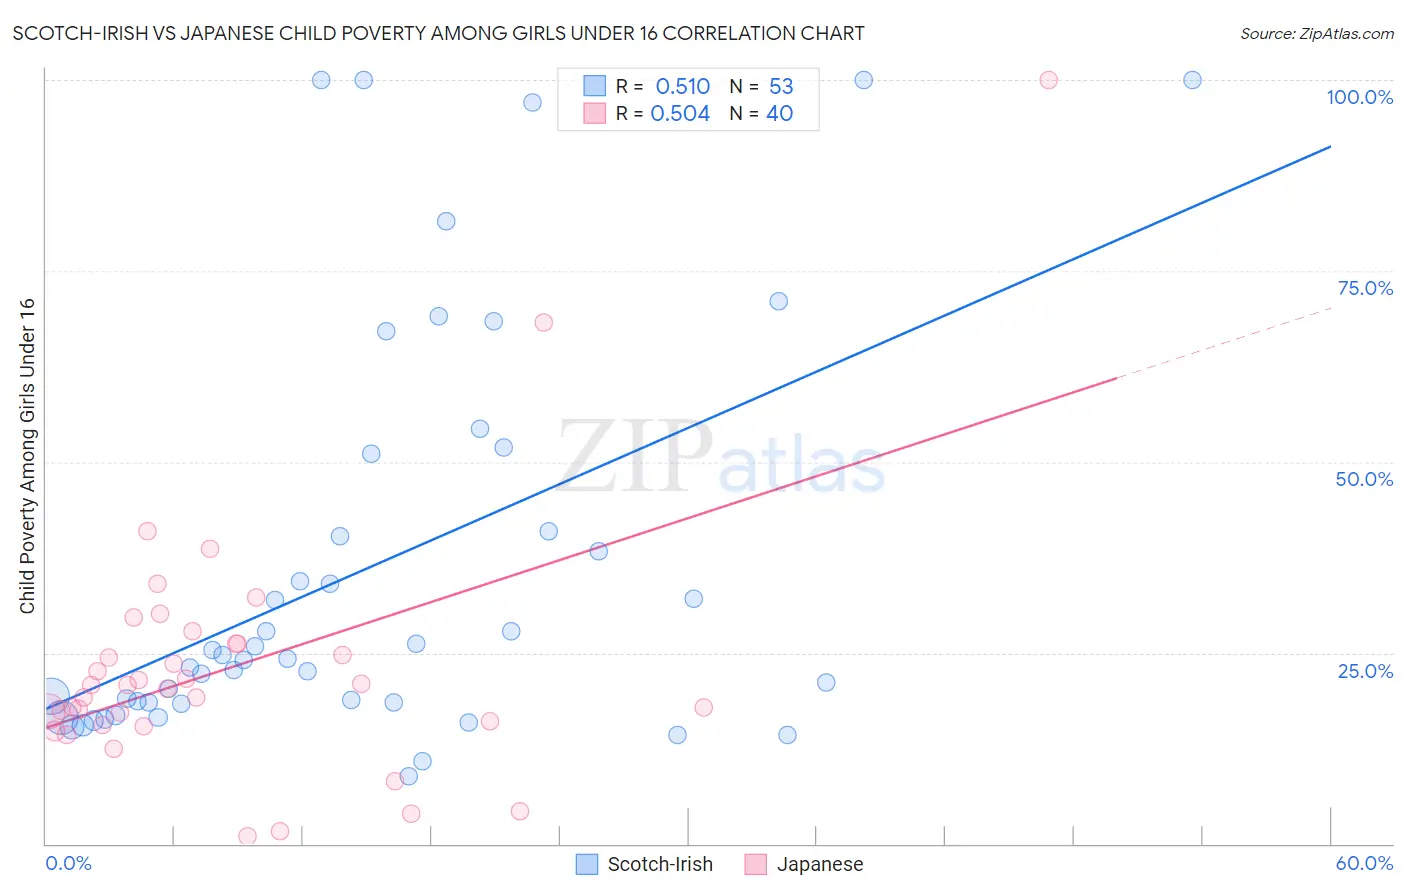
Scotch-Irish vs Japanese Child Poverty Among Girls Under 16 Correlation Chart
The statistical analysis conducted on geographies consisting of 529,237,473 people shows a substantial positive correlation between the proportion of Scotch-Irish and poverty level among girls under the age of 16 in the United States with a correlation coefficient (R) of 0.510 and weighted average of 16.7%. Similarly, the statistical analysis conducted on geographies consisting of 247,332,708 people shows a substantial positive correlation between the proportion of Japanese and poverty level among girls under the age of 16 in the United States with a correlation coefficient (R) of 0.504 and weighted average of 17.8%, a difference of 7.0%.
Child Poverty Among Girls Under 16 Correlation Summary
| Measurement | Scotch-Irish | Japanese |
| Minimum | 8.9% | 1.0% |
| Maximum | 100.0% | 100.0% |
| Range | 91.1% | 99.0% |
| Mean | 36.0% | 23.2% |
| Median | 24.2% | 20.5% |
| Interquartile 25% (IQ1) | 18.5% | 15.8% |
| Interquartile 75% (IQ3) | 46.0% | 26.2% |
| Interquartile Range (IQR) | 27.6% | 10.4% |
| Standard Deviation (Sample) | 26.7% | 17.1% |
| Standard Deviation (Population) | 26.4% | 16.9% |
Similar Demographics by Child Poverty Among Girls Under 16
Demographics Similar to Scotch-Irish by Child Poverty Among Girls Under 16
In terms of child poverty among girls under 16, the demographic groups most similar to Scotch-Irish are Immigrants from Portugal (16.6%, a difference of 0.34%), Immigrants from Ethiopia (16.6%, a difference of 0.41%), Immigrants from Iraq (16.6%, a difference of 0.42%), Immigrants from Syria (16.6%, a difference of 0.44%), and Hawaiian (16.6%, a difference of 0.45%).
| Demographics | Rating | Rank | Child Poverty Among Girls Under 16 |
| Immigrants | Western Asia | 44.1 /100 | #177 | Average 16.6% |
| Whites/Caucasians | 43.6 /100 | #178 | Average 16.6% |
| Hawaiians | 43.4 /100 | #179 | Average 16.6% |
| Immigrants | Syria | 43.3 /100 | #180 | Average 16.6% |
| Immigrants | Iraq | 43.2 /100 | #181 | Average 16.6% |
| Immigrants | Ethiopia | 43.1 /100 | #182 | Average 16.6% |
| Immigrants | Portugal | 42.5 /100 | #183 | Average 16.6% |
| Scotch-Irish | 39.6 /100 | #184 | Fair 16.7% |
| Immigrants | Uruguay | 35.6 /100 | #185 | Fair 16.7% |
| South American Indians | 35.0 /100 | #186 | Fair 16.8% |
| Immigrants | Morocco | 34.6 /100 | #187 | Fair 16.8% |
| Arabs | 34.5 /100 | #188 | Fair 16.8% |
| Immigrants | Bosnia and Herzegovina | 32.5 /100 | #189 | Fair 16.8% |
| Kenyans | 32.3 /100 | #190 | Fair 16.8% |
| Immigrants | Azores | 31.3 /100 | #191 | Fair 16.8% |
Demographics Similar to Japanese by Child Poverty Among Girls Under 16
In terms of child poverty among girls under 16, the demographic groups most similar to Japanese are Moroccan (17.8%, a difference of 0.090%), Alaska Native (17.8%, a difference of 0.10%), Malaysian (17.8%, a difference of 0.19%), German Russian (17.8%, a difference of 0.19%), and Pennsylvania German (17.8%, a difference of 0.21%).
| Demographics | Rating | Rank | Child Poverty Among Girls Under 16 |
| Immigrants | Immigrants | 7.3 /100 | #210 | Tragic 17.7% |
| Immigrants | Eastern Africa | 6.4 /100 | #211 | Tragic 17.7% |
| Immigrants | Thailand | 6.3 /100 | #212 | Tragic 17.7% |
| Pennsylvania Germans | 5.7 /100 | #213 | Tragic 17.8% |
| Malaysians | 5.7 /100 | #214 | Tragic 17.8% |
| German Russians | 5.7 /100 | #215 | Tragic 17.8% |
| Moroccans | 5.5 /100 | #216 | Tragic 17.8% |
| Japanese | 5.3 /100 | #217 | Tragic 17.8% |
| Alaska Natives | 5.2 /100 | #218 | Tragic 17.8% |
| Immigrants | Panama | 4.7 /100 | #219 | Tragic 17.9% |
| Cubans | 4.1 /100 | #220 | Tragic 18.0% |
| Immigrants | Micronesia | 3.5 /100 | #221 | Tragic 18.0% |
| Immigrants | Cambodia | 2.9 /100 | #222 | Tragic 18.1% |
| Immigrants | Armenia | 2.9 /100 | #223 | Tragic 18.1% |
| Bermudans | 2.8 /100 | #224 | Tragic 18.1% |