Scotch-Irish vs Peruvian Child Poverty Among Girls Under 16
COMPARE
Scotch-Irish
Peruvian
Child Poverty Among Girls Under 16
Child Poverty Among Girls Under 16 Comparison
Scotch-Irish
Peruvians
16.7%
CHILD POVERTY AMONG GIRLS UNDER 16
39.6/ 100
METRIC RATING
184th/ 347
METRIC RANK
15.4%
CHILD POVERTY AMONG GIRLS UNDER 16
91.2/ 100
METRIC RATING
125th/ 347
METRIC RANK
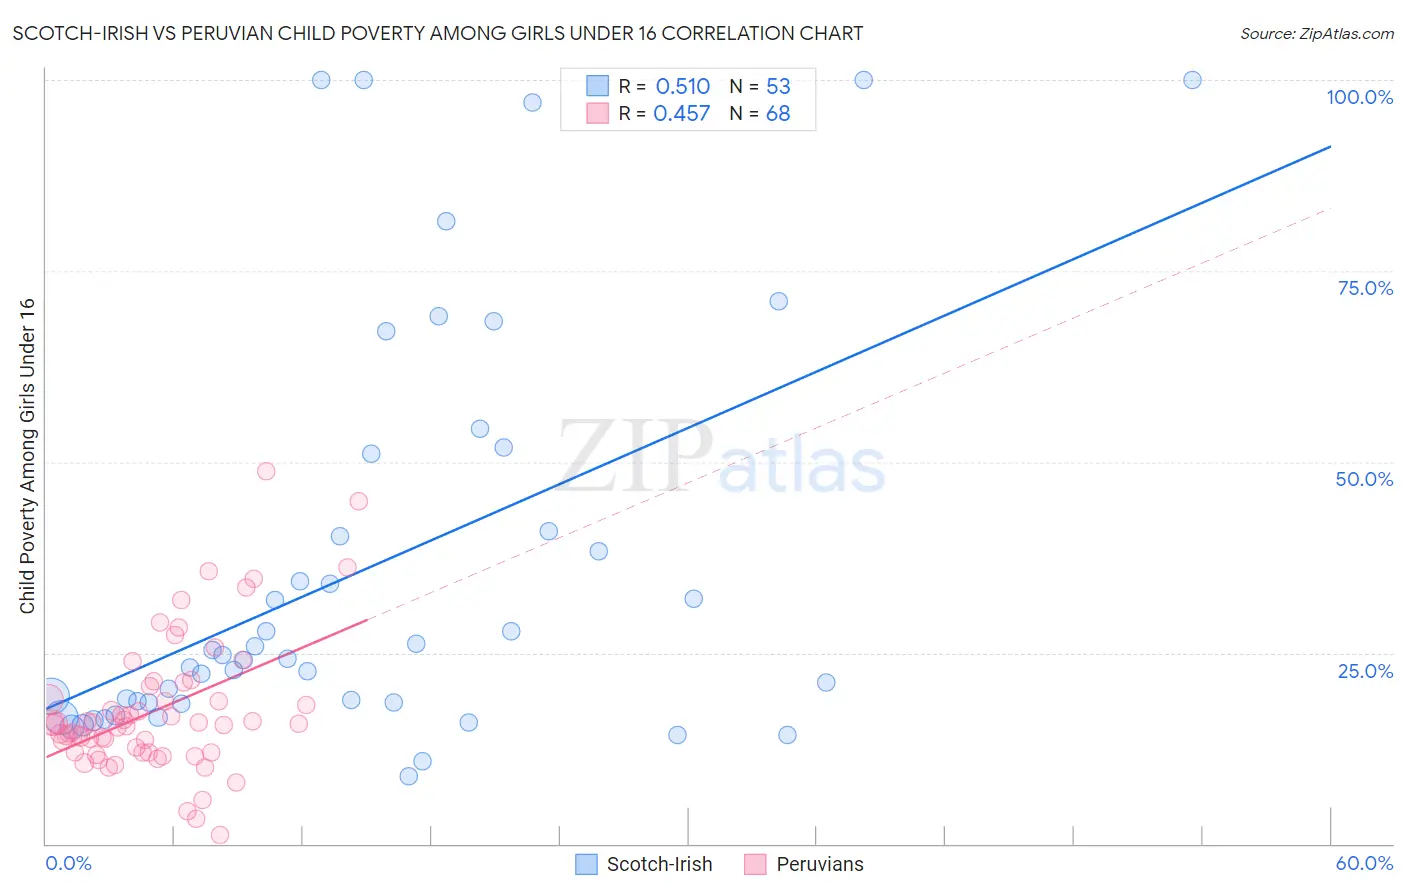
Scotch-Irish vs Peruvian Child Poverty Among Girls Under 16 Correlation Chart
The statistical analysis conducted on geographies consisting of 529,237,473 people shows a substantial positive correlation between the proportion of Scotch-Irish and poverty level among girls under the age of 16 in the United States with a correlation coefficient (R) of 0.510 and weighted average of 16.7%. Similarly, the statistical analysis conducted on geographies consisting of 357,519,236 people shows a moderate positive correlation between the proportion of Peruvians and poverty level among girls under the age of 16 in the United States with a correlation coefficient (R) of 0.457 and weighted average of 15.4%, a difference of 8.5%.
Child Poverty Among Girls Under 16 Correlation Summary
| Measurement | Scotch-Irish | Peruvian |
| Minimum | 8.9% | 1.1% |
| Maximum | 100.0% | 48.7% |
| Range | 91.1% | 47.7% |
| Mean | 36.0% | 17.5% |
| Median | 24.2% | 15.6% |
| Interquartile 25% (IQ1) | 18.5% | 12.0% |
| Interquartile 75% (IQ3) | 46.0% | 19.8% |
| Interquartile Range (IQR) | 27.6% | 7.8% |
| Standard Deviation (Sample) | 26.7% | 8.9% |
| Standard Deviation (Population) | 26.4% | 8.8% |
Similar Demographics by Child Poverty Among Girls Under 16
Demographics Similar to Scotch-Irish by Child Poverty Among Girls Under 16
In terms of child poverty among girls under 16, the demographic groups most similar to Scotch-Irish are Immigrants from Portugal (16.6%, a difference of 0.34%), Immigrants from Ethiopia (16.6%, a difference of 0.41%), Immigrants from Iraq (16.6%, a difference of 0.42%), Immigrants from Syria (16.6%, a difference of 0.44%), and Hawaiian (16.6%, a difference of 0.45%).
| Demographics | Rating | Rank | Child Poverty Among Girls Under 16 |
| Immigrants | Western Asia | 44.1 /100 | #177 | Average 16.6% |
| Whites/Caucasians | 43.6 /100 | #178 | Average 16.6% |
| Hawaiians | 43.4 /100 | #179 | Average 16.6% |
| Immigrants | Syria | 43.3 /100 | #180 | Average 16.6% |
| Immigrants | Iraq | 43.2 /100 | #181 | Average 16.6% |
| Immigrants | Ethiopia | 43.1 /100 | #182 | Average 16.6% |
| Immigrants | Portugal | 42.5 /100 | #183 | Average 16.6% |
| Scotch-Irish | 39.6 /100 | #184 | Fair 16.7% |
| Immigrants | Uruguay | 35.6 /100 | #185 | Fair 16.7% |
| South American Indians | 35.0 /100 | #186 | Fair 16.8% |
| Immigrants | Morocco | 34.6 /100 | #187 | Fair 16.8% |
| Arabs | 34.5 /100 | #188 | Fair 16.8% |
| Immigrants | Bosnia and Herzegovina | 32.5 /100 | #189 | Fair 16.8% |
| Kenyans | 32.3 /100 | #190 | Fair 16.8% |
| Immigrants | Azores | 31.3 /100 | #191 | Fair 16.8% |
Demographics Similar to Peruvians by Child Poverty Among Girls Under 16
In terms of child poverty among girls under 16, the demographic groups most similar to Peruvians are Scottish (15.4%, a difference of 0.070%), Carpatho Rusyn (15.3%, a difference of 0.11%), Immigrants from Norway (15.4%, a difference of 0.13%), Irish (15.3%, a difference of 0.15%), and Albanian (15.4%, a difference of 0.23%).
| Demographics | Rating | Rank | Child Poverty Among Girls Under 16 |
| Immigrants | Southern Europe | 92.7 /100 | #118 | Exceptional 15.3% |
| Immigrants | Zimbabwe | 92.5 /100 | #119 | Exceptional 15.3% |
| Pakistanis | 92.3 /100 | #120 | Exceptional 15.3% |
| English | 92.2 /100 | #121 | Exceptional 15.3% |
| Portuguese | 91.8 /100 | #122 | Exceptional 15.3% |
| Irish | 91.5 /100 | #123 | Exceptional 15.3% |
| Carpatho Rusyns | 91.4 /100 | #124 | Exceptional 15.3% |
| Peruvians | 91.2 /100 | #125 | Exceptional 15.4% |
| Scottish | 91.0 /100 | #126 | Exceptional 15.4% |
| Immigrants | Norway | 90.8 /100 | #127 | Exceptional 15.4% |
| Albanians | 90.5 /100 | #128 | Exceptional 15.4% |
| Immigrants | South Eastern Asia | 90.5 /100 | #129 | Exceptional 15.4% |
| Puget Sound Salish | 90.1 /100 | #130 | Exceptional 15.4% |
| Immigrants | Western Europe | 90.0 /100 | #131 | Exceptional 15.4% |
| Mongolians | 89.7 /100 | #132 | Excellent 15.4% |