Tlingit-Haida vs Japanese Child Poverty Among Girls Under 16
COMPARE
Tlingit-Haida
Japanese
Child Poverty Among Girls Under 16
Child Poverty Among Girls Under 16 Comparison
Tlingit-Haida
Japanese
14.7%
CHILD POVERTY AMONG GIRLS UNDER 16
97.9/ 100
METRIC RATING
77th/ 347
METRIC RANK
17.8%
CHILD POVERTY AMONG GIRLS UNDER 16
5.3/ 100
METRIC RATING
217th/ 347
METRIC RANK
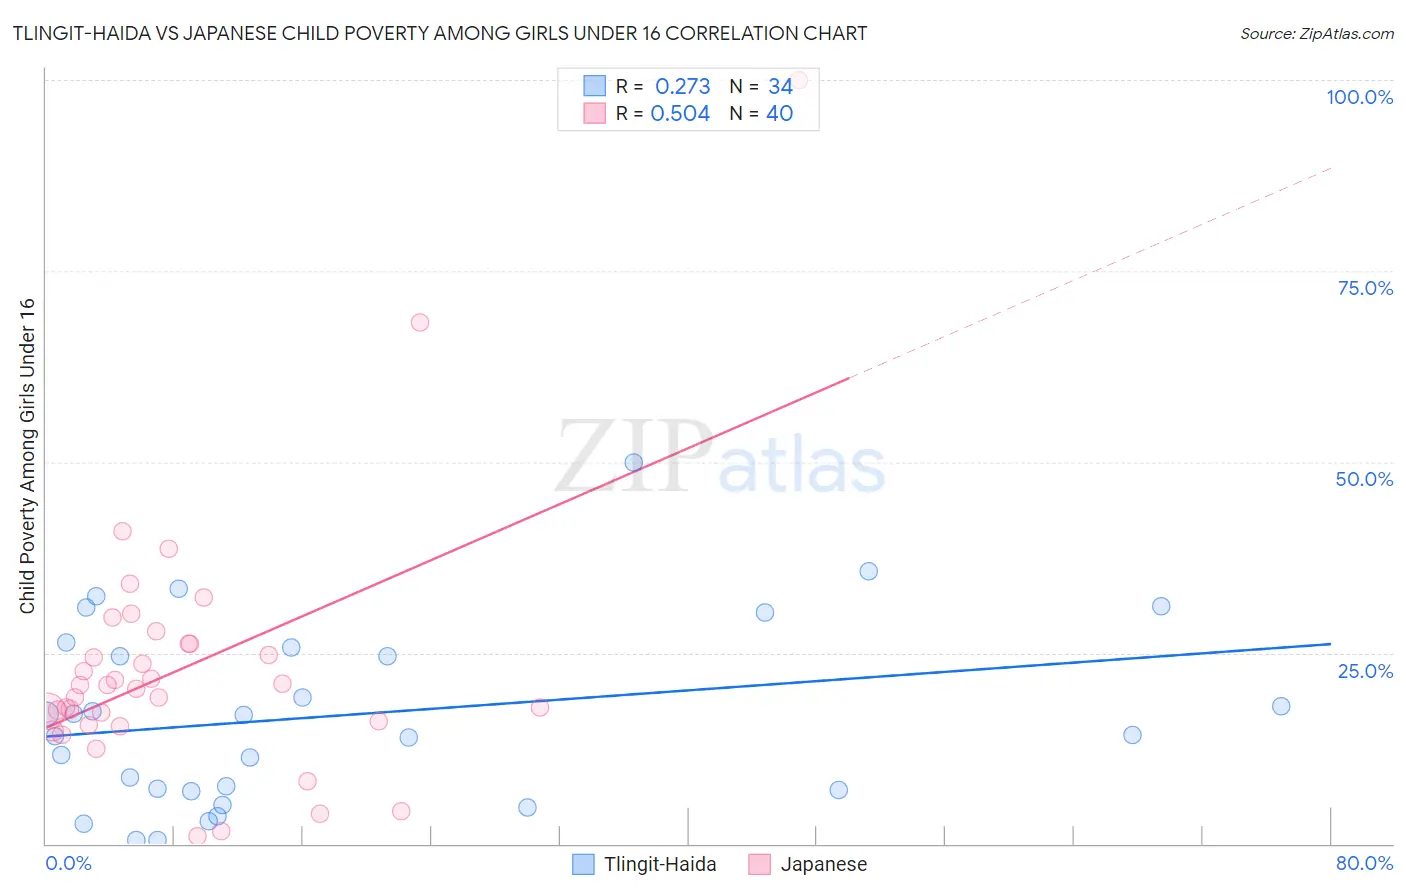
Tlingit-Haida vs Japanese Child Poverty Among Girls Under 16 Correlation Chart
The statistical analysis conducted on geographies consisting of 60,606,017 people shows a weak positive correlation between the proportion of Tlingit-Haida and poverty level among girls under the age of 16 in the United States with a correlation coefficient (R) of 0.273 and weighted average of 14.7%. Similarly, the statistical analysis conducted on geographies consisting of 247,332,708 people shows a substantial positive correlation between the proportion of Japanese and poverty level among girls under the age of 16 in the United States with a correlation coefficient (R) of 0.504 and weighted average of 17.8%, a difference of 21.7%.
Child Poverty Among Girls Under 16 Correlation Summary
| Measurement | Tlingit-Haida | Japanese |
| Minimum | 0.43% | 1.0% |
| Maximum | 50.0% | 100.0% |
| Range | 49.6% | 99.0% |
| Mean | 16.8% | 23.2% |
| Median | 15.6% | 20.5% |
| Interquartile 25% (IQ1) | 7.0% | 15.8% |
| Interquartile 75% (IQ3) | 25.7% | 26.2% |
| Interquartile Range (IQR) | 18.7% | 10.4% |
| Standard Deviation (Sample) | 12.0% | 17.1% |
| Standard Deviation (Population) | 11.8% | 16.9% |
Similar Demographics by Child Poverty Among Girls Under 16
Demographics Similar to Tlingit-Haida by Child Poverty Among Girls Under 16
In terms of child poverty among girls under 16, the demographic groups most similar to Tlingit-Haida are Immigrants from Russia (14.7%, a difference of 0.010%), Argentinean (14.7%, a difference of 0.010%), Immigrants from Turkey (14.7%, a difference of 0.020%), Egyptian (14.7%, a difference of 0.030%), and Immigrants from Eastern Europe (14.6%, a difference of 0.16%).
| Demographics | Rating | Rank | Child Poverty Among Girls Under 16 |
| Europeans | 98.1 /100 | #70 | Exceptional 14.6% |
| Slovenes | 98.1 /100 | #71 | Exceptional 14.6% |
| Immigrants | Netherlands | 98.1 /100 | #72 | Exceptional 14.6% |
| Immigrants | Austria | 98.0 /100 | #73 | Exceptional 14.6% |
| Taiwanese | 98.0 /100 | #74 | Exceptional 14.6% |
| Immigrants | Eastern Europe | 98.0 /100 | #75 | Exceptional 14.6% |
| Immigrants | Russia | 97.9 /100 | #76 | Exceptional 14.7% |
| Tlingit-Haida | 97.9 /100 | #77 | Exceptional 14.7% |
| Argentineans | 97.9 /100 | #78 | Exceptional 14.7% |
| Immigrants | Turkey | 97.9 /100 | #79 | Exceptional 14.7% |
| Egyptians | 97.9 /100 | #80 | Exceptional 14.7% |
| Ukrainians | 97.7 /100 | #81 | Exceptional 14.7% |
| Macedonians | 97.6 /100 | #82 | Exceptional 14.7% |
| Immigrants | Italy | 97.4 /100 | #83 | Exceptional 14.8% |
| Soviet Union | 97.3 /100 | #84 | Exceptional 14.8% |
Demographics Similar to Japanese by Child Poverty Among Girls Under 16
In terms of child poverty among girls under 16, the demographic groups most similar to Japanese are Moroccan (17.8%, a difference of 0.090%), Alaska Native (17.8%, a difference of 0.10%), Malaysian (17.8%, a difference of 0.19%), German Russian (17.8%, a difference of 0.19%), and Pennsylvania German (17.8%, a difference of 0.21%).
| Demographics | Rating | Rank | Child Poverty Among Girls Under 16 |
| Immigrants | Immigrants | 7.3 /100 | #210 | Tragic 17.7% |
| Immigrants | Eastern Africa | 6.4 /100 | #211 | Tragic 17.7% |
| Immigrants | Thailand | 6.3 /100 | #212 | Tragic 17.7% |
| Pennsylvania Germans | 5.7 /100 | #213 | Tragic 17.8% |
| Malaysians | 5.7 /100 | #214 | Tragic 17.8% |
| German Russians | 5.7 /100 | #215 | Tragic 17.8% |
| Moroccans | 5.5 /100 | #216 | Tragic 17.8% |
| Japanese | 5.3 /100 | #217 | Tragic 17.8% |
| Alaska Natives | 5.2 /100 | #218 | Tragic 17.8% |
| Immigrants | Panama | 4.7 /100 | #219 | Tragic 17.9% |
| Cubans | 4.1 /100 | #220 | Tragic 18.0% |
| Immigrants | Micronesia | 3.5 /100 | #221 | Tragic 18.0% |
| Immigrants | Cambodia | 2.9 /100 | #222 | Tragic 18.1% |
| Immigrants | Armenia | 2.9 /100 | #223 | Tragic 18.1% |
| Bermudans | 2.8 /100 | #224 | Tragic 18.1% |