Scotch-Irish vs Polish Child Poverty Among Girls Under 16
COMPARE
Scotch-Irish
Polish
Child Poverty Among Girls Under 16
Child Poverty Among Girls Under 16 Comparison
Scotch-Irish
Poles
16.7%
CHILD POVERTY AMONG GIRLS UNDER 16
39.6/ 100
METRIC RATING
184th/ 347
METRIC RANK
14.4%
CHILD POVERTY AMONG GIRLS UNDER 16
98.7/ 100
METRIC RATING
60th/ 347
METRIC RANK
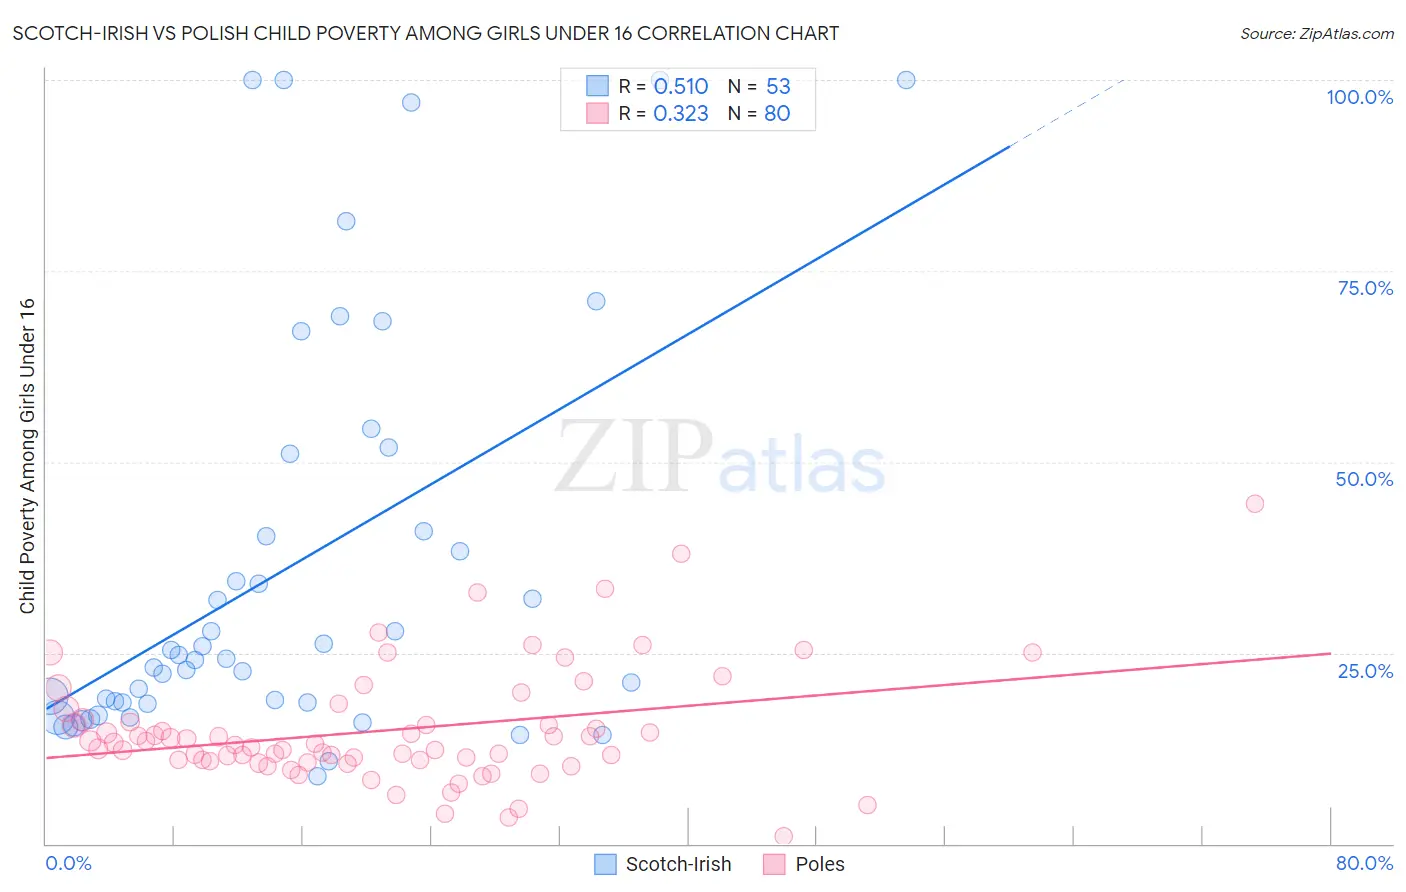
Scotch-Irish vs Polish Child Poverty Among Girls Under 16 Correlation Chart
The statistical analysis conducted on geographies consisting of 529,237,473 people shows a substantial positive correlation between the proportion of Scotch-Irish and poverty level among girls under the age of 16 in the United States with a correlation coefficient (R) of 0.510 and weighted average of 16.7%. Similarly, the statistical analysis conducted on geographies consisting of 538,484,152 people shows a mild positive correlation between the proportion of Poles and poverty level among girls under the age of 16 in the United States with a correlation coefficient (R) of 0.323 and weighted average of 14.4%, a difference of 15.7%.
Child Poverty Among Girls Under 16 Correlation Summary
| Measurement | Scotch-Irish | Polish |
| Minimum | 8.9% | 1.0% |
| Maximum | 100.0% | 44.4% |
| Range | 91.1% | 43.4% |
| Mean | 36.0% | 14.9% |
| Median | 24.2% | 13.0% |
| Interquartile 25% (IQ1) | 18.5% | 10.8% |
| Interquartile 75% (IQ3) | 46.0% | 16.1% |
| Interquartile Range (IQR) | 27.6% | 5.2% |
| Standard Deviation (Sample) | 26.7% | 7.6% |
| Standard Deviation (Population) | 26.4% | 7.6% |
Similar Demographics by Child Poverty Among Girls Under 16
Demographics Similar to Scotch-Irish by Child Poverty Among Girls Under 16
In terms of child poverty among girls under 16, the demographic groups most similar to Scotch-Irish are Immigrants from Portugal (16.6%, a difference of 0.34%), Immigrants from Ethiopia (16.6%, a difference of 0.41%), Immigrants from Iraq (16.6%, a difference of 0.42%), Immigrants from Syria (16.6%, a difference of 0.44%), and Hawaiian (16.6%, a difference of 0.45%).
| Demographics | Rating | Rank | Child Poverty Among Girls Under 16 |
| Immigrants | Western Asia | 44.1 /100 | #177 | Average 16.6% |
| Whites/Caucasians | 43.6 /100 | #178 | Average 16.6% |
| Hawaiians | 43.4 /100 | #179 | Average 16.6% |
| Immigrants | Syria | 43.3 /100 | #180 | Average 16.6% |
| Immigrants | Iraq | 43.2 /100 | #181 | Average 16.6% |
| Immigrants | Ethiopia | 43.1 /100 | #182 | Average 16.6% |
| Immigrants | Portugal | 42.5 /100 | #183 | Average 16.6% |
| Scotch-Irish | 39.6 /100 | #184 | Fair 16.7% |
| Immigrants | Uruguay | 35.6 /100 | #185 | Fair 16.7% |
| South American Indians | 35.0 /100 | #186 | Fair 16.8% |
| Immigrants | Morocco | 34.6 /100 | #187 | Fair 16.8% |
| Arabs | 34.5 /100 | #188 | Fair 16.8% |
| Immigrants | Bosnia and Herzegovina | 32.5 /100 | #189 | Fair 16.8% |
| Kenyans | 32.3 /100 | #190 | Fair 16.8% |
| Immigrants | Azores | 31.3 /100 | #191 | Fair 16.8% |
Demographics Similar to Poles by Child Poverty Among Girls Under 16
In terms of child poverty among girls under 16, the demographic groups most similar to Poles are Cambodian (14.4%, a difference of 0.0%), Scandinavian (14.4%, a difference of 0.12%), Immigrants from Europe (14.4%, a difference of 0.16%), Zimbabwean (14.4%, a difference of 0.19%), and Immigrants from Bulgaria (14.4%, a difference of 0.25%).
| Demographics | Rating | Rank | Child Poverty Among Girls Under 16 |
| Luxembourgers | 99.0 /100 | #53 | Exceptional 14.3% |
| Estonians | 98.9 /100 | #54 | Exceptional 14.3% |
| Immigrants | Romania | 98.9 /100 | #55 | Exceptional 14.3% |
| Immigrants | Indonesia | 98.9 /100 | #56 | Exceptional 14.4% |
| Immigrants | Serbia | 98.9 /100 | #57 | Exceptional 14.4% |
| Immigrants | Bulgaria | 98.8 /100 | #58 | Exceptional 14.4% |
| Zimbabweans | 98.8 /100 | #59 | Exceptional 14.4% |
| Poles | 98.7 /100 | #60 | Exceptional 14.4% |
| Cambodians | 98.7 /100 | #61 | Exceptional 14.4% |
| Scandinavians | 98.7 /100 | #62 | Exceptional 14.4% |
| Immigrants | Europe | 98.7 /100 | #63 | Exceptional 14.4% |
| Immigrants | Philippines | 98.6 /100 | #64 | Exceptional 14.4% |
| Immigrants | Sweden | 98.6 /100 | #65 | Exceptional 14.5% |
| Immigrants | Belgium | 98.5 /100 | #66 | Exceptional 14.5% |
| Laotians | 98.4 /100 | #67 | Exceptional 14.5% |