Scotch-Irish vs Choctaw Child Poverty Among Girls Under 16
COMPARE
Scotch-Irish
Choctaw
Child Poverty Among Girls Under 16
Child Poverty Among Girls Under 16 Comparison
Scotch-Irish
Choctaw
16.7%
CHILD POVERTY AMONG GIRLS UNDER 16
39.6/ 100
METRIC RATING
184th/ 347
METRIC RANK
21.1%
CHILD POVERTY AMONG GIRLS UNDER 16
0.0/ 100
METRIC RATING
301st/ 347
METRIC RANK
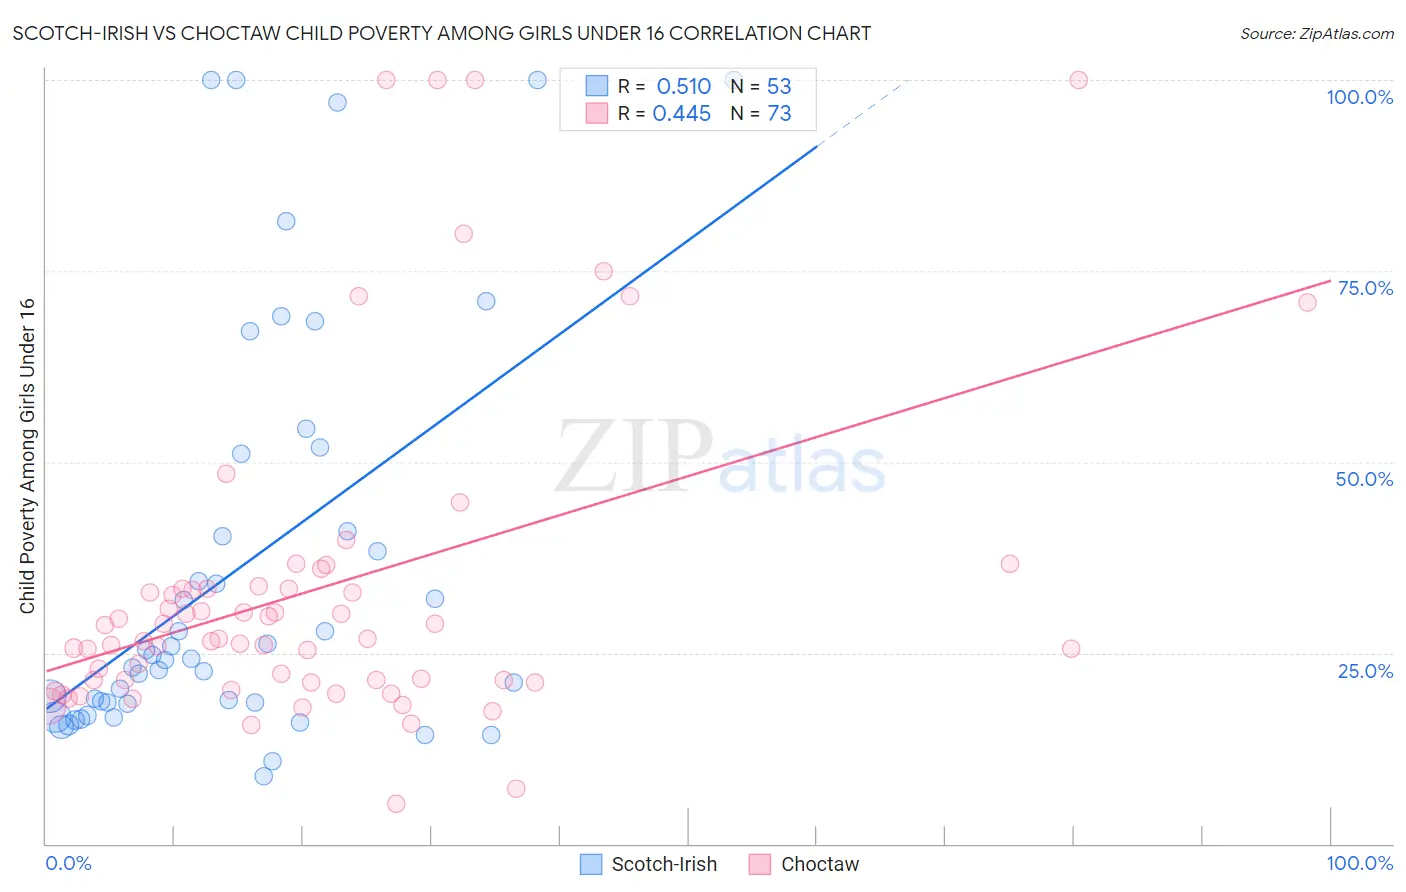
Scotch-Irish vs Choctaw Child Poverty Among Girls Under 16 Correlation Chart
The statistical analysis conducted on geographies consisting of 529,237,473 people shows a substantial positive correlation between the proportion of Scotch-Irish and poverty level among girls under the age of 16 in the United States with a correlation coefficient (R) of 0.510 and weighted average of 16.7%. Similarly, the statistical analysis conducted on geographies consisting of 267,369,694 people shows a moderate positive correlation between the proportion of Choctaw and poverty level among girls under the age of 16 in the United States with a correlation coefficient (R) of 0.445 and weighted average of 21.1%, a difference of 26.9%.
Child Poverty Among Girls Under 16 Correlation Summary
| Measurement | Scotch-Irish | Choctaw |
| Minimum | 8.9% | 5.3% |
| Maximum | 100.0% | 100.0% |
| Range | 91.1% | 94.7% |
| Mean | 36.0% | 33.5% |
| Median | 24.2% | 26.8% |
| Interquartile 25% (IQ1) | 18.5% | 21.2% |
| Interquartile 75% (IQ3) | 46.0% | 33.4% |
| Interquartile Range (IQR) | 27.6% | 12.2% |
| Standard Deviation (Sample) | 26.7% | 21.5% |
| Standard Deviation (Population) | 26.4% | 21.3% |
Similar Demographics by Child Poverty Among Girls Under 16
Demographics Similar to Scotch-Irish by Child Poverty Among Girls Under 16
In terms of child poverty among girls under 16, the demographic groups most similar to Scotch-Irish are Immigrants from Portugal (16.6%, a difference of 0.34%), Immigrants from Ethiopia (16.6%, a difference of 0.41%), Immigrants from Iraq (16.6%, a difference of 0.42%), Immigrants from Syria (16.6%, a difference of 0.44%), and Hawaiian (16.6%, a difference of 0.45%).
| Demographics | Rating | Rank | Child Poverty Among Girls Under 16 |
| Immigrants | Western Asia | 44.1 /100 | #177 | Average 16.6% |
| Whites/Caucasians | 43.6 /100 | #178 | Average 16.6% |
| Hawaiians | 43.4 /100 | #179 | Average 16.6% |
| Immigrants | Syria | 43.3 /100 | #180 | Average 16.6% |
| Immigrants | Iraq | 43.2 /100 | #181 | Average 16.6% |
| Immigrants | Ethiopia | 43.1 /100 | #182 | Average 16.6% |
| Immigrants | Portugal | 42.5 /100 | #183 | Average 16.6% |
| Scotch-Irish | 39.6 /100 | #184 | Fair 16.7% |
| Immigrants | Uruguay | 35.6 /100 | #185 | Fair 16.7% |
| South American Indians | 35.0 /100 | #186 | Fair 16.8% |
| Immigrants | Morocco | 34.6 /100 | #187 | Fair 16.8% |
| Arabs | 34.5 /100 | #188 | Fair 16.8% |
| Immigrants | Bosnia and Herzegovina | 32.5 /100 | #189 | Fair 16.8% |
| Kenyans | 32.3 /100 | #190 | Fair 16.8% |
| Immigrants | Azores | 31.3 /100 | #191 | Fair 16.8% |
Demographics Similar to Choctaw by Child Poverty Among Girls Under 16
In terms of child poverty among girls under 16, the demographic groups most similar to Choctaw are Seminole (21.2%, a difference of 0.12%), British West Indian (21.3%, a difference of 0.57%), Indonesian (21.3%, a difference of 0.60%), Somali (21.0%, a difference of 0.62%), and Hispanic or Latino (21.0%, a difference of 0.93%).
| Demographics | Rating | Rank | Child Poverty Among Girls Under 16 |
| Immigrants | Senegal | 0.0 /100 | #294 | Tragic 20.7% |
| Immigrants | Caribbean | 0.0 /100 | #295 | Tragic 20.7% |
| Immigrants | West Indies | 0.0 /100 | #296 | Tragic 20.7% |
| Inupiat | 0.0 /100 | #297 | Tragic 20.8% |
| Mexicans | 0.0 /100 | #298 | Tragic 20.9% |
| Hispanics or Latinos | 0.0 /100 | #299 | Tragic 21.0% |
| Somalis | 0.0 /100 | #300 | Tragic 21.0% |
| Choctaw | 0.0 /100 | #301 | Tragic 21.1% |
| Seminole | 0.0 /100 | #302 | Tragic 21.2% |
| British West Indians | 0.0 /100 | #303 | Tragic 21.3% |
| Indonesians | 0.0 /100 | #304 | Tragic 21.3% |
| Guatemalans | 0.0 /100 | #305 | Tragic 21.4% |
| Immigrants | Central America | 0.0 /100 | #306 | Tragic 21.4% |
| Immigrants | Bahamas | 0.0 /100 | #307 | Tragic 21.4% |
| Houma | 0.0 /100 | #308 | Tragic 21.5% |