Paraguayan vs Tlingit-Haida Single Father Poverty
COMPARE
Paraguayan
Tlingit-Haida
Single Father Poverty
Single Father Poverty Comparison
Paraguayans
Tlingit-Haida
15.2%
SINGLE FATHER POVERTY
99.7/ 100
METRIC RATING
67th/ 347
METRIC RANK
15.3%
SINGLE FATHER POVERTY
99.5/ 100
METRIC RATING
78th/ 347
METRIC RANK
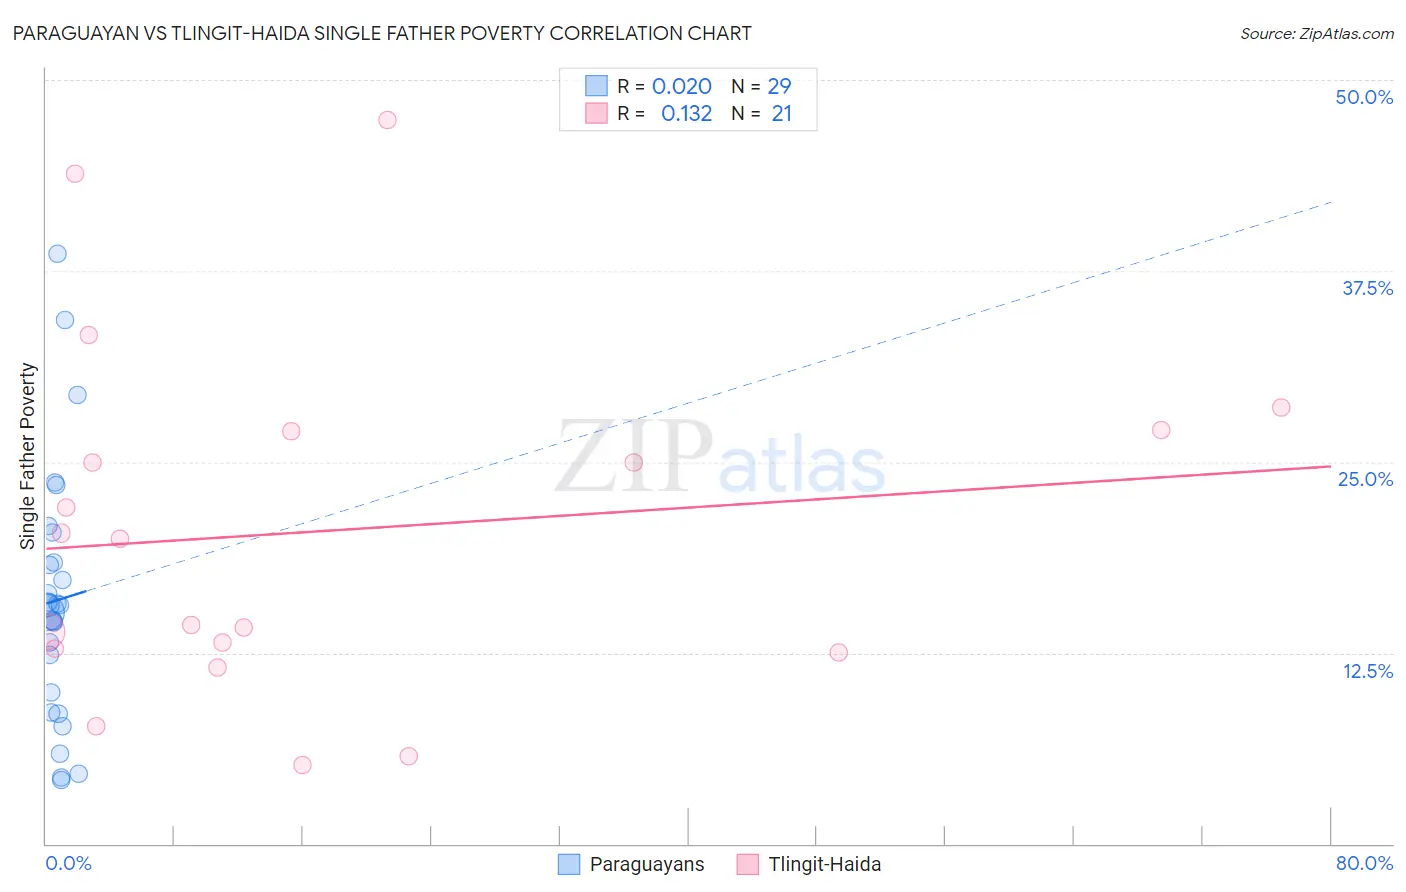
Paraguayan vs Tlingit-Haida Single Father Poverty Correlation Chart
The statistical analysis conducted on geographies consisting of 86,793,016 people shows no correlation between the proportion of Paraguayans and poverty level among single fathers in the United States with a correlation coefficient (R) of 0.020 and weighted average of 15.2%. Similarly, the statistical analysis conducted on geographies consisting of 55,978,156 people shows a poor positive correlation between the proportion of Tlingit-Haida and poverty level among single fathers in the United States with a correlation coefficient (R) of 0.132 and weighted average of 15.3%, a difference of 0.84%.
Single Father Poverty Correlation Summary
| Measurement | Paraguayan | Tlingit-Haida |
| Minimum | 4.2% | 5.1% |
| Maximum | 38.6% | 47.4% |
| Range | 34.4% | 42.2% |
| Mean | 15.9% | 20.5% |
| Median | 15.6% | 20.0% |
| Interquartile 25% (IQ1) | 9.3% | 12.6% |
| Interquartile 75% (IQ3) | 19.4% | 27.1% |
| Interquartile Range (IQR) | 10.1% | 14.4% |
| Standard Deviation (Sample) | 8.3% | 11.5% |
| Standard Deviation (Population) | 8.2% | 11.2% |
Demographics Similar to Paraguayans and Tlingit-Haida by Single Father Poverty
In terms of single father poverty, the demographic groups most similar to Paraguayans are Immigrants from Moldova (15.2%, a difference of 0.090%), Immigrants from Cameroon (15.2%, a difference of 0.090%), Immigrants from Malaysia (15.2%, a difference of 0.11%), Japanese (15.2%, a difference of 0.11%), and Bangladeshi (15.2%, a difference of 0.20%). Similarly, the demographic groups most similar to Tlingit-Haida are Immigrants from Northern Africa (15.3%, a difference of 0.020%), Immigrants from Peru (15.3%, a difference of 0.050%), Immigrants from Japan (15.3%, a difference of 0.060%), Immigrants from Turkey (15.3%, a difference of 0.14%), and Maltese (15.3%, a difference of 0.16%).
| Demographics | Rating | Rank | Single Father Poverty |
| Immigrants | Armenia | 99.8 /100 | #62 | Exceptional 15.2% |
| Immigrants | Sweden | 99.8 /100 | #63 | Exceptional 15.2% |
| Bangladeshis | 99.8 /100 | #64 | Exceptional 15.2% |
| Immigrants | Malaysia | 99.8 /100 | #65 | Exceptional 15.2% |
| Immigrants | Moldova | 99.8 /100 | #66 | Exceptional 15.2% |
| Paraguayans | 99.7 /100 | #67 | Exceptional 15.2% |
| Immigrants | Cameroon | 99.7 /100 | #68 | Exceptional 15.2% |
| Japanese | 99.7 /100 | #69 | Exceptional 15.2% |
| Mongolians | 99.7 /100 | #70 | Exceptional 15.3% |
| Immigrants | Brazil | 99.6 /100 | #71 | Exceptional 15.3% |
| Immigrants | Lithuania | 99.6 /100 | #72 | Exceptional 15.3% |
| Kenyans | 99.6 /100 | #73 | Exceptional 15.3% |
| Maltese | 99.6 /100 | #74 | Exceptional 15.3% |
| Immigrants | Turkey | 99.5 /100 | #75 | Exceptional 15.3% |
| Immigrants | Japan | 99.5 /100 | #76 | Exceptional 15.3% |
| Immigrants | Peru | 99.5 /100 | #77 | Exceptional 15.3% |
| Tlingit-Haida | 99.5 /100 | #78 | Exceptional 15.3% |
| Immigrants | Northern Africa | 99.5 /100 | #79 | Exceptional 15.3% |
| Armenians | 99.4 /100 | #80 | Exceptional 15.4% |
| Immigrants | Congo | 99.4 /100 | #81 | Exceptional 15.4% |
| Immigrants | Ukraine | 99.4 /100 | #82 | Exceptional 15.4% |