Potawatomi vs Tlingit-Haida Single Father Poverty
COMPARE
Potawatomi
Tlingit-Haida
Single Father Poverty
Single Father Poverty Comparison
Potawatomi
Tlingit-Haida
18.9%
SINGLE FATHER POVERTY
0.0/ 100
METRIC RATING
313th/ 347
METRIC RANK
15.3%
SINGLE FATHER POVERTY
99.5/ 100
METRIC RATING
78th/ 347
METRIC RANK
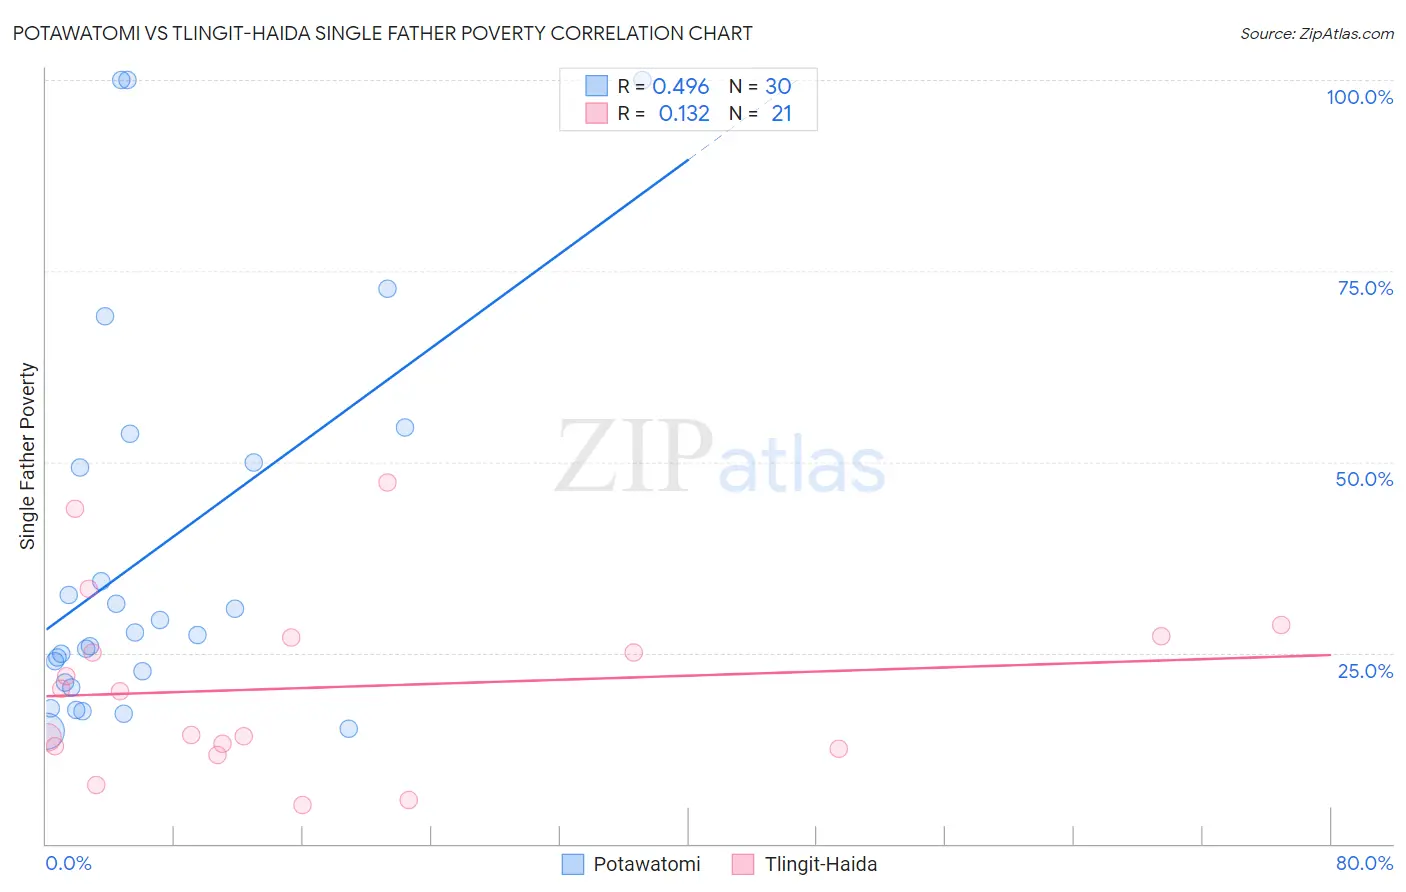
Potawatomi vs Tlingit-Haida Single Father Poverty Correlation Chart
The statistical analysis conducted on geographies consisting of 106,133,326 people shows a moderate positive correlation between the proportion of Potawatomi and poverty level among single fathers in the United States with a correlation coefficient (R) of 0.496 and weighted average of 18.9%. Similarly, the statistical analysis conducted on geographies consisting of 55,978,156 people shows a poor positive correlation between the proportion of Tlingit-Haida and poverty level among single fathers in the United States with a correlation coefficient (R) of 0.132 and weighted average of 15.3%, a difference of 23.1%.
Single Father Poverty Correlation Summary
| Measurement | Potawatomi | Tlingit-Haida |
| Minimum | 14.8% | 5.1% |
| Maximum | 100.0% | 47.4% |
| Range | 85.2% | 42.2% |
| Mean | 38.4% | 20.5% |
| Median | 27.5% | 20.0% |
| Interquartile 25% (IQ1) | 21.1% | 12.6% |
| Interquartile 75% (IQ3) | 50.0% | 27.1% |
| Interquartile Range (IQR) | 28.9% | 14.4% |
| Standard Deviation (Sample) | 25.8% | 11.5% |
| Standard Deviation (Population) | 25.4% | 11.2% |
Similar Demographics by Single Father Poverty
Demographics Similar to Potawatomi by Single Father Poverty
In terms of single father poverty, the demographic groups most similar to Potawatomi are Delaware (18.9%, a difference of 0.16%), Immigrants from Dominica (18.9%, a difference of 0.20%), Nonimmigrants (18.8%, a difference of 0.25%), Chickasaw (19.0%, a difference of 0.32%), and Chippewa (18.8%, a difference of 0.44%).
| Demographics | Rating | Rank | Single Father Poverty |
| Scotch-Irish | 0.0 /100 | #306 | Tragic 18.6% |
| French Canadians | 0.0 /100 | #307 | Tragic 18.6% |
| Ottawa | 0.0 /100 | #308 | Tragic 18.6% |
| Immigrants | Micronesia | 0.0 /100 | #309 | Tragic 18.6% |
| Chippewa | 0.0 /100 | #310 | Tragic 18.8% |
| Immigrants | Nonimmigrants | 0.0 /100 | #311 | Tragic 18.8% |
| Immigrants | Dominica | 0.0 /100 | #312 | Tragic 18.9% |
| Potawatomi | 0.0 /100 | #313 | Tragic 18.9% |
| Delaware | 0.0 /100 | #314 | Tragic 18.9% |
| Chickasaw | 0.0 /100 | #315 | Tragic 19.0% |
| Osage | 0.0 /100 | #316 | Tragic 19.0% |
| Dominicans | 0.0 /100 | #317 | Tragic 19.1% |
| Dutch West Indians | 0.0 /100 | #318 | Tragic 19.2% |
| Slovaks | 0.0 /100 | #319 | Tragic 19.3% |
| Inupiat | 0.0 /100 | #320 | Tragic 19.5% |
Demographics Similar to Tlingit-Haida by Single Father Poverty
In terms of single father poverty, the demographic groups most similar to Tlingit-Haida are Immigrants from Northern Africa (15.3%, a difference of 0.020%), Immigrants from Peru (15.3%, a difference of 0.050%), Immigrants from Japan (15.3%, a difference of 0.060%), Immigrants from Turkey (15.3%, a difference of 0.14%), and Maltese (15.3%, a difference of 0.16%).
| Demographics | Rating | Rank | Single Father Poverty |
| Immigrants | Brazil | 99.6 /100 | #71 | Exceptional 15.3% |
| Immigrants | Lithuania | 99.6 /100 | #72 | Exceptional 15.3% |
| Kenyans | 99.6 /100 | #73 | Exceptional 15.3% |
| Maltese | 99.6 /100 | #74 | Exceptional 15.3% |
| Immigrants | Turkey | 99.5 /100 | #75 | Exceptional 15.3% |
| Immigrants | Japan | 99.5 /100 | #76 | Exceptional 15.3% |
| Immigrants | Peru | 99.5 /100 | #77 | Exceptional 15.3% |
| Tlingit-Haida | 99.5 /100 | #78 | Exceptional 15.3% |
| Immigrants | Northern Africa | 99.5 /100 | #79 | Exceptional 15.3% |
| Armenians | 99.4 /100 | #80 | Exceptional 15.4% |
| Immigrants | Congo | 99.4 /100 | #81 | Exceptional 15.4% |
| Immigrants | Ukraine | 99.4 /100 | #82 | Exceptional 15.4% |
| Chinese | 99.3 /100 | #83 | Exceptional 15.4% |
| Peruvians | 99.2 /100 | #84 | Exceptional 15.4% |
| Immigrants | Oceania | 99.1 /100 | #85 | Exceptional 15.4% |