Paraguayan vs Immigrants from Saudi Arabia Single Father Poverty
COMPARE
Paraguayan
Immigrants from Saudi Arabia
Single Father Poverty
Single Father Poverty Comparison
Paraguayans
Immigrants from Saudi Arabia
15.2%
SINGLE FATHER POVERTY
99.7/ 100
METRIC RATING
67th/ 347
METRIC RANK
16.9%
SINGLE FATHER POVERTY
2.7/ 100
METRIC RATING
238th/ 347
METRIC RANK
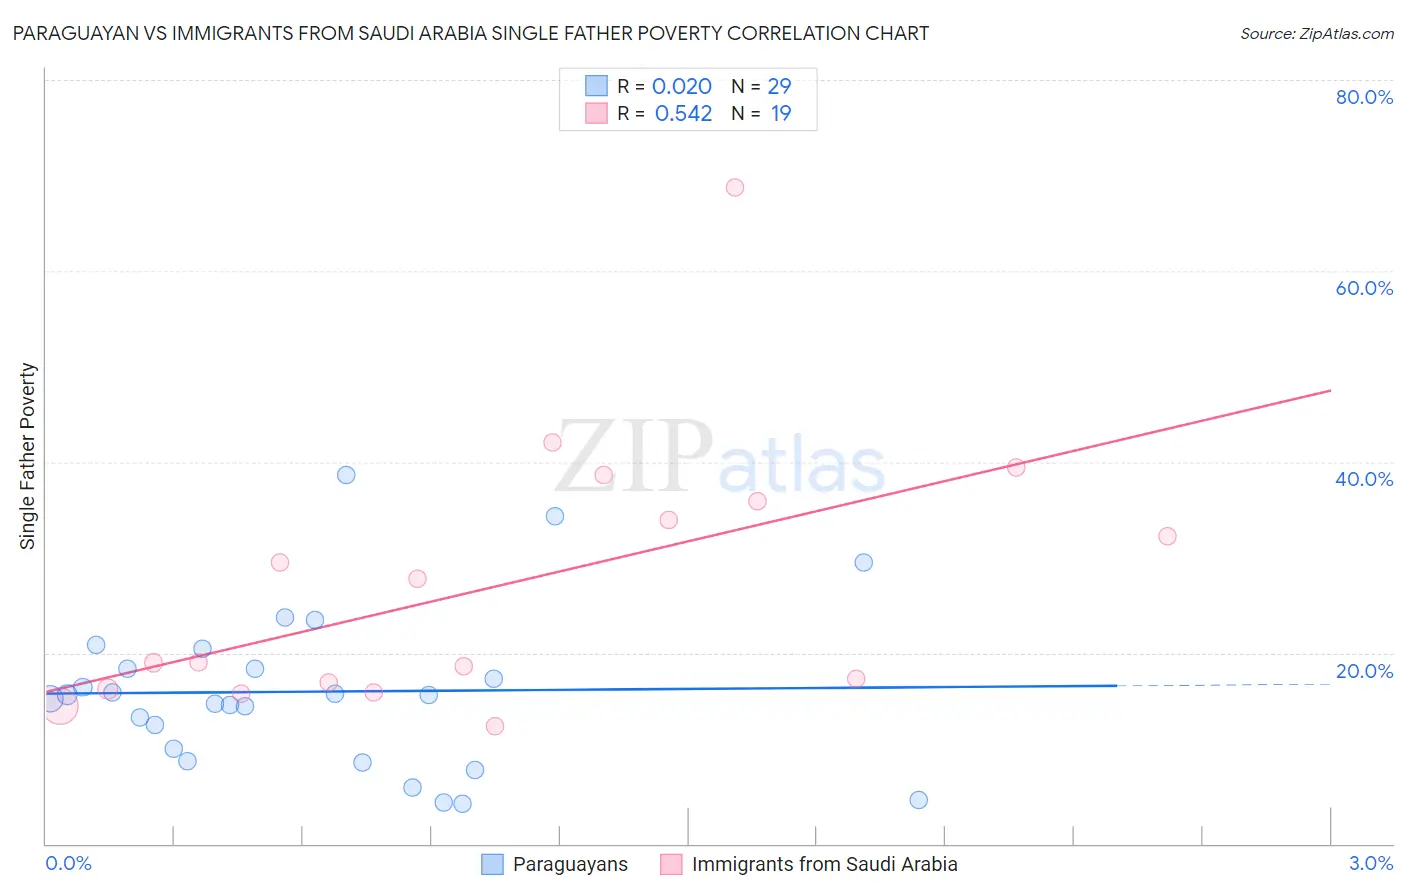
Paraguayan vs Immigrants from Saudi Arabia Single Father Poverty Correlation Chart
The statistical analysis conducted on geographies consisting of 86,793,016 people shows no correlation between the proportion of Paraguayans and poverty level among single fathers in the United States with a correlation coefficient (R) of 0.020 and weighted average of 15.2%. Similarly, the statistical analysis conducted on geographies consisting of 144,012,732 people shows a substantial positive correlation between the proportion of Immigrants from Saudi Arabia and poverty level among single fathers in the United States with a correlation coefficient (R) of 0.542 and weighted average of 16.9%, a difference of 11.3%.
Single Father Poverty Correlation Summary
| Measurement | Paraguayan | Immigrants from Saudi Arabia |
| Minimum | 4.2% | 12.3% |
| Maximum | 38.6% | 68.8% |
| Range | 34.4% | 56.4% |
| Mean | 15.9% | 27.0% |
| Median | 15.6% | 19.0% |
| Interquartile 25% (IQ1) | 9.3% | 16.2% |
| Interquartile 75% (IQ3) | 19.4% | 35.9% |
| Interquartile Range (IQR) | 10.1% | 19.7% |
| Standard Deviation (Sample) | 8.3% | 14.1% |
| Standard Deviation (Population) | 8.2% | 13.7% |
Similar Demographics by Single Father Poverty
Demographics Similar to Paraguayans by Single Father Poverty
In terms of single father poverty, the demographic groups most similar to Paraguayans are Immigrants from Moldova (15.2%, a difference of 0.090%), Immigrants from Cameroon (15.2%, a difference of 0.090%), Immigrants from Malaysia (15.2%, a difference of 0.11%), Japanese (15.2%, a difference of 0.11%), and Bangladeshi (15.2%, a difference of 0.20%).
| Demographics | Rating | Rank | Single Father Poverty |
| Puget Sound Salish | 99.8 /100 | #60 | Exceptional 15.2% |
| Immigrants | Bosnia and Herzegovina | 99.8 /100 | #61 | Exceptional 15.2% |
| Immigrants | Armenia | 99.8 /100 | #62 | Exceptional 15.2% |
| Immigrants | Sweden | 99.8 /100 | #63 | Exceptional 15.2% |
| Bangladeshis | 99.8 /100 | #64 | Exceptional 15.2% |
| Immigrants | Malaysia | 99.8 /100 | #65 | Exceptional 15.2% |
| Immigrants | Moldova | 99.8 /100 | #66 | Exceptional 15.2% |
| Paraguayans | 99.7 /100 | #67 | Exceptional 15.2% |
| Immigrants | Cameroon | 99.7 /100 | #68 | Exceptional 15.2% |
| Japanese | 99.7 /100 | #69 | Exceptional 15.2% |
| Mongolians | 99.7 /100 | #70 | Exceptional 15.3% |
| Immigrants | Brazil | 99.6 /100 | #71 | Exceptional 15.3% |
| Immigrants | Lithuania | 99.6 /100 | #72 | Exceptional 15.3% |
| Kenyans | 99.6 /100 | #73 | Exceptional 15.3% |
| Maltese | 99.6 /100 | #74 | Exceptional 15.3% |
Demographics Similar to Immigrants from Saudi Arabia by Single Father Poverty
In terms of single father poverty, the demographic groups most similar to Immigrants from Saudi Arabia are Bermudan (16.9%, a difference of 0.020%), Finnish (16.9%, a difference of 0.030%), Immigrants from Western Europe (16.9%, a difference of 0.070%), Immigrants from Germany (16.9%, a difference of 0.070%), and Subsaharan African (16.9%, a difference of 0.070%).
| Demographics | Rating | Rank | Single Father Poverty |
| Spanish Americans | 3.7 /100 | #231 | Tragic 16.9% |
| Immigrants | Grenada | 3.7 /100 | #232 | Tragic 16.9% |
| Senegalese | 3.2 /100 | #233 | Tragic 16.9% |
| Marshallese | 3.1 /100 | #234 | Tragic 16.9% |
| Immigrants | Western Europe | 2.9 /100 | #235 | Tragic 16.9% |
| Immigrants | Germany | 2.9 /100 | #236 | Tragic 16.9% |
| Sub-Saharan Africans | 2.9 /100 | #237 | Tragic 16.9% |
| Immigrants | Saudi Arabia | 2.7 /100 | #238 | Tragic 16.9% |
| Bermudans | 2.6 /100 | #239 | Tragic 16.9% |
| Finns | 2.6 /100 | #240 | Tragic 16.9% |
| Czechs | 2.3 /100 | #241 | Tragic 17.0% |
| Moroccans | 2.1 /100 | #242 | Tragic 17.0% |
| Immigrants | Cabo Verde | 1.6 /100 | #243 | Tragic 17.0% |
| Hondurans | 1.6 /100 | #244 | Tragic 17.0% |
| Trinidadians and Tobagonians | 1.5 /100 | #245 | Tragic 17.0% |