Immigrants from Iraq vs Tlingit-Haida Single Father Poverty
COMPARE
Immigrants from Iraq
Tlingit-Haida
Single Father Poverty
Single Father Poverty Comparison
Immigrants from Iraq
Tlingit-Haida
14.3%
SINGLE FATHER POVERTY
100.0/ 100
METRIC RATING
19th/ 347
METRIC RANK
15.3%
SINGLE FATHER POVERTY
99.5/ 100
METRIC RATING
78th/ 347
METRIC RANK
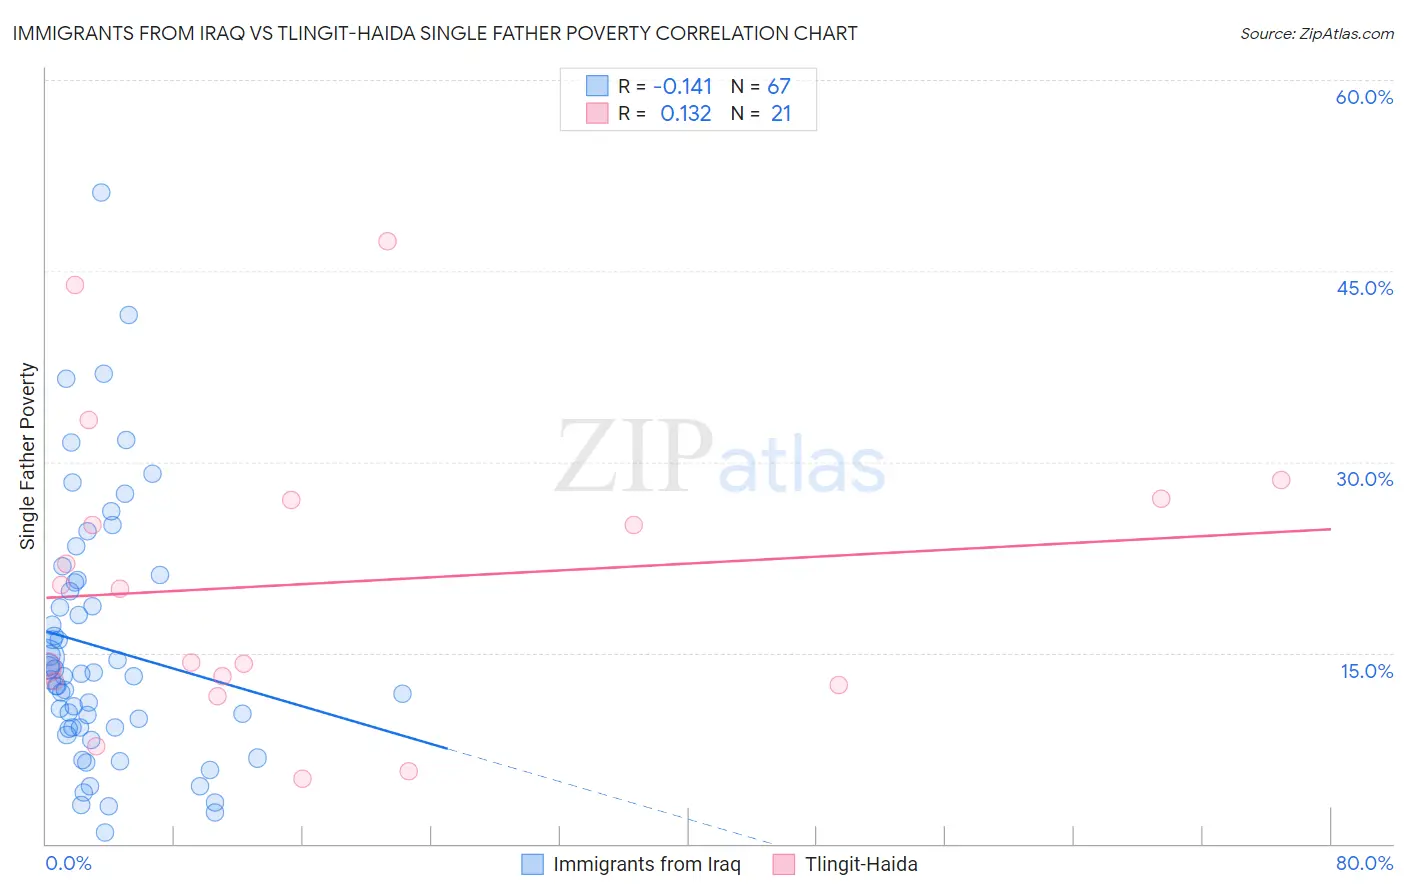
Immigrants from Iraq vs Tlingit-Haida Single Father Poverty Correlation Chart
The statistical analysis conducted on geographies consisting of 166,597,560 people shows a poor negative correlation between the proportion of Immigrants from Iraq and poverty level among single fathers in the United States with a correlation coefficient (R) of -0.141 and weighted average of 14.3%. Similarly, the statistical analysis conducted on geographies consisting of 55,978,156 people shows a poor positive correlation between the proportion of Tlingit-Haida and poverty level among single fathers in the United States with a correlation coefficient (R) of 0.132 and weighted average of 15.3%, a difference of 7.6%.
Single Father Poverty Correlation Summary
| Measurement | Immigrants from Iraq | Tlingit-Haida |
| Minimum | 0.90% | 5.1% |
| Maximum | 51.1% | 47.4% |
| Range | 50.2% | 42.2% |
| Mean | 15.4% | 20.5% |
| Median | 13.2% | 20.0% |
| Interquartile 25% (IQ1) | 9.1% | 12.6% |
| Interquartile 75% (IQ3) | 20.6% | 27.1% |
| Interquartile Range (IQR) | 11.4% | 14.4% |
| Standard Deviation (Sample) | 10.0% | 11.5% |
| Standard Deviation (Population) | 9.9% | 11.2% |
Similar Demographics by Single Father Poverty
Demographics Similar to Immigrants from Iraq by Single Father Poverty
In terms of single father poverty, the demographic groups most similar to Immigrants from Iraq are Soviet Union (14.3%, a difference of 0.040%), Immigrants from Singapore (14.3%, a difference of 0.040%), Immigrants from Hong Kong (14.2%, a difference of 0.070%), Immigrants from Afghanistan (14.3%, a difference of 0.14%), and Taiwanese (14.3%, a difference of 0.47%).
| Demographics | Rating | Rank | Single Father Poverty |
| Immigrants | India | 100.0 /100 | #12 | Exceptional 14.0% |
| Immigrants | Philippines | 100.0 /100 | #13 | Exceptional 14.0% |
| Immigrants | Vietnam | 100.0 /100 | #14 | Exceptional 14.1% |
| Sri Lankans | 100.0 /100 | #15 | Exceptional 14.2% |
| Immigrants | Iran | 100.0 /100 | #16 | Exceptional 14.2% |
| Immigrants | Hong Kong | 100.0 /100 | #17 | Exceptional 14.2% |
| Soviet Union | 100.0 /100 | #18 | Exceptional 14.3% |
| Immigrants | Iraq | 100.0 /100 | #19 | Exceptional 14.3% |
| Immigrants | Singapore | 100.0 /100 | #20 | Exceptional 14.3% |
| Immigrants | Afghanistan | 100.0 /100 | #21 | Exceptional 14.3% |
| Taiwanese | 100.0 /100 | #22 | Exceptional 14.3% |
| Immigrants | Egypt | 100.0 /100 | #23 | Exceptional 14.4% |
| Immigrants | South Eastern Asia | 100.0 /100 | #24 | Exceptional 14.4% |
| Iranians | 100.0 /100 | #25 | Exceptional 14.4% |
| Spanish American Indians | 100.0 /100 | #26 | Exceptional 14.4% |
Demographics Similar to Tlingit-Haida by Single Father Poverty
In terms of single father poverty, the demographic groups most similar to Tlingit-Haida are Immigrants from Northern Africa (15.3%, a difference of 0.020%), Immigrants from Peru (15.3%, a difference of 0.050%), Immigrants from Japan (15.3%, a difference of 0.060%), Immigrants from Turkey (15.3%, a difference of 0.14%), and Maltese (15.3%, a difference of 0.16%).
| Demographics | Rating | Rank | Single Father Poverty |
| Immigrants | Brazil | 99.6 /100 | #71 | Exceptional 15.3% |
| Immigrants | Lithuania | 99.6 /100 | #72 | Exceptional 15.3% |
| Kenyans | 99.6 /100 | #73 | Exceptional 15.3% |
| Maltese | 99.6 /100 | #74 | Exceptional 15.3% |
| Immigrants | Turkey | 99.5 /100 | #75 | Exceptional 15.3% |
| Immigrants | Japan | 99.5 /100 | #76 | Exceptional 15.3% |
| Immigrants | Peru | 99.5 /100 | #77 | Exceptional 15.3% |
| Tlingit-Haida | 99.5 /100 | #78 | Exceptional 15.3% |
| Immigrants | Northern Africa | 99.5 /100 | #79 | Exceptional 15.3% |
| Armenians | 99.4 /100 | #80 | Exceptional 15.4% |
| Immigrants | Congo | 99.4 /100 | #81 | Exceptional 15.4% |
| Immigrants | Ukraine | 99.4 /100 | #82 | Exceptional 15.4% |
| Chinese | 99.3 /100 | #83 | Exceptional 15.4% |
| Peruvians | 99.2 /100 | #84 | Exceptional 15.4% |
| Immigrants | Oceania | 99.1 /100 | #85 | Exceptional 15.4% |