Paraguayan vs Immigrants from Norway Single Father Poverty
COMPARE
Paraguayan
Immigrants from Norway
Single Father Poverty
Single Father Poverty Comparison
Paraguayans
Immigrants from Norway
15.2%
SINGLE FATHER POVERTY
99.7/ 100
METRIC RATING
67th/ 347
METRIC RANK
16.8%
SINGLE FATHER POVERTY
6.5/ 100
METRIC RATING
224th/ 347
METRIC RANK
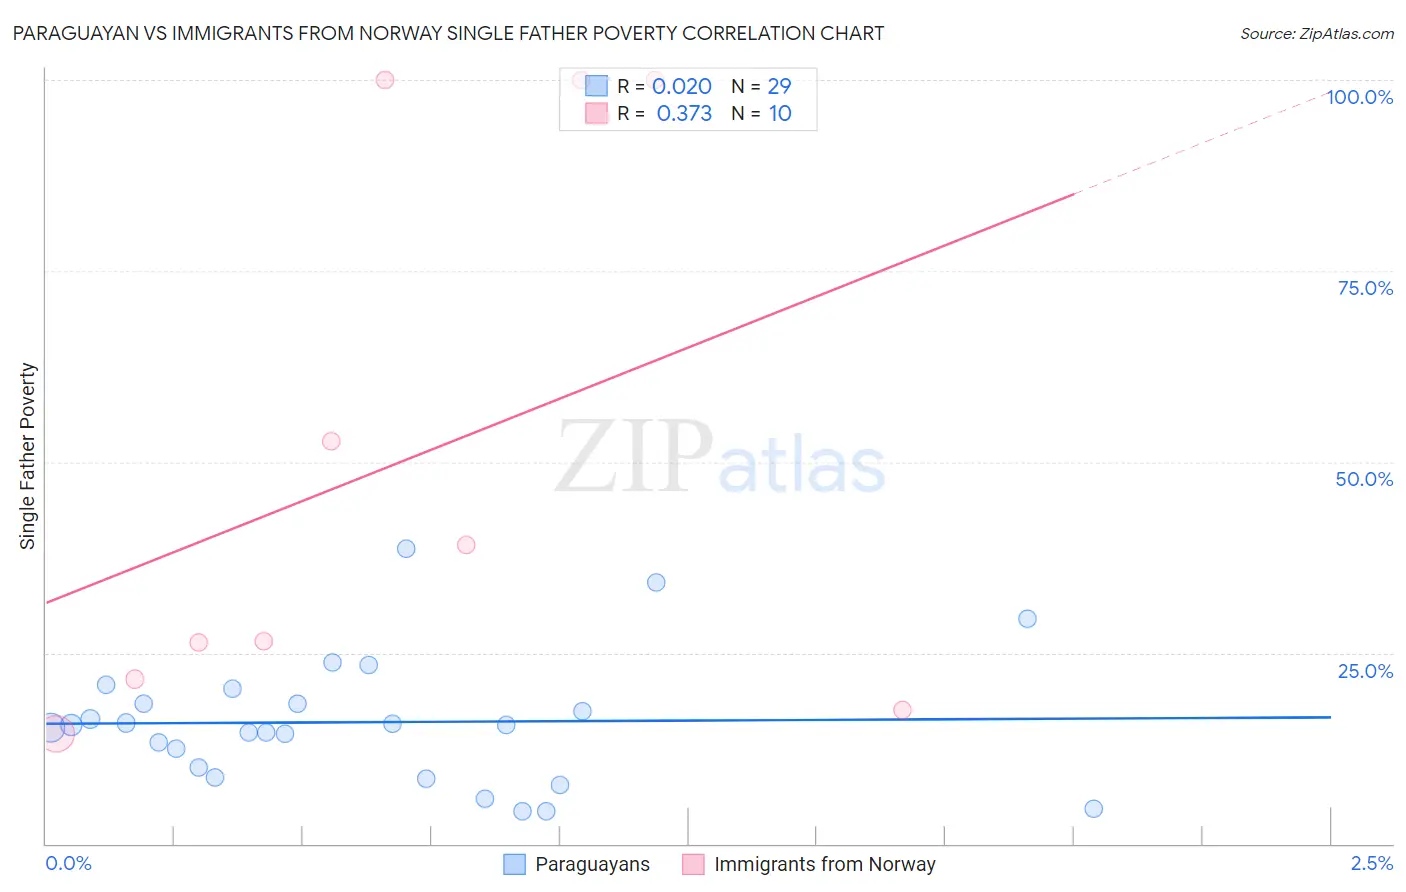
Paraguayan vs Immigrants from Norway Single Father Poverty Correlation Chart
The statistical analysis conducted on geographies consisting of 86,793,016 people shows no correlation between the proportion of Paraguayans and poverty level among single fathers in the United States with a correlation coefficient (R) of 0.020 and weighted average of 15.2%. Similarly, the statistical analysis conducted on geographies consisting of 101,345,089 people shows a mild positive correlation between the proportion of Immigrants from Norway and poverty level among single fathers in the United States with a correlation coefficient (R) of 0.373 and weighted average of 16.8%, a difference of 10.2%.
Single Father Poverty Correlation Summary
| Measurement | Paraguayan | Immigrants from Norway |
| Minimum | 4.2% | 14.5% |
| Maximum | 38.6% | 100.0% |
| Range | 34.4% | 85.5% |
| Mean | 15.9% | 49.8% |
| Median | 15.6% | 32.8% |
| Interquartile 25% (IQ1) | 9.3% | 21.6% |
| Interquartile 75% (IQ3) | 19.4% | 100.0% |
| Interquartile Range (IQR) | 10.1% | 78.4% |
| Standard Deviation (Sample) | 8.3% | 36.3% |
| Standard Deviation (Population) | 8.2% | 34.4% |
Similar Demographics by Single Father Poverty
Demographics Similar to Paraguayans by Single Father Poverty
In terms of single father poverty, the demographic groups most similar to Paraguayans are Immigrants from Moldova (15.2%, a difference of 0.090%), Immigrants from Cameroon (15.2%, a difference of 0.090%), Immigrants from Malaysia (15.2%, a difference of 0.11%), Japanese (15.2%, a difference of 0.11%), and Bangladeshi (15.2%, a difference of 0.20%).
| Demographics | Rating | Rank | Single Father Poverty |
| Puget Sound Salish | 99.8 /100 | #60 | Exceptional 15.2% |
| Immigrants | Bosnia and Herzegovina | 99.8 /100 | #61 | Exceptional 15.2% |
| Immigrants | Armenia | 99.8 /100 | #62 | Exceptional 15.2% |
| Immigrants | Sweden | 99.8 /100 | #63 | Exceptional 15.2% |
| Bangladeshis | 99.8 /100 | #64 | Exceptional 15.2% |
| Immigrants | Malaysia | 99.8 /100 | #65 | Exceptional 15.2% |
| Immigrants | Moldova | 99.8 /100 | #66 | Exceptional 15.2% |
| Paraguayans | 99.7 /100 | #67 | Exceptional 15.2% |
| Immigrants | Cameroon | 99.7 /100 | #68 | Exceptional 15.2% |
| Japanese | 99.7 /100 | #69 | Exceptional 15.2% |
| Mongolians | 99.7 /100 | #70 | Exceptional 15.3% |
| Immigrants | Brazil | 99.6 /100 | #71 | Exceptional 15.3% |
| Immigrants | Lithuania | 99.6 /100 | #72 | Exceptional 15.3% |
| Kenyans | 99.6 /100 | #73 | Exceptional 15.3% |
| Maltese | 99.6 /100 | #74 | Exceptional 15.3% |
Demographics Similar to Immigrants from Norway by Single Father Poverty
In terms of single father poverty, the demographic groups most similar to Immigrants from Norway are Menominee (16.8%, a difference of 0.020%), Hispanic or Latino (16.8%, a difference of 0.070%), Immigrants from Austria (16.8%, a difference of 0.080%), British (16.8%, a difference of 0.16%), and Belgian (16.8%, a difference of 0.23%).
| Demographics | Rating | Rank | Single Father Poverty |
| Cheyenne | 9.3 /100 | #217 | Tragic 16.7% |
| Immigrants | Uganda | 8.6 /100 | #218 | Tragic 16.7% |
| Immigrants | Ghana | 8.1 /100 | #219 | Tragic 16.7% |
| Immigrants | Denmark | 8.1 /100 | #220 | Tragic 16.7% |
| Immigrants | Greece | 8.1 /100 | #221 | Tragic 16.7% |
| Immigrants | Spain | 8.0 /100 | #222 | Tragic 16.7% |
| Immigrants | Austria | 7.0 /100 | #223 | Tragic 16.8% |
| Immigrants | Norway | 6.5 /100 | #224 | Tragic 16.8% |
| Menominee | 6.4 /100 | #225 | Tragic 16.8% |
| Hispanics or Latinos | 6.1 /100 | #226 | Tragic 16.8% |
| British | 5.6 /100 | #227 | Tragic 16.8% |
| Belgians | 5.3 /100 | #228 | Tragic 16.8% |
| Israelis | 4.6 /100 | #229 | Tragic 16.8% |
| Immigrants | Trinidad and Tobago | 4.5 /100 | #230 | Tragic 16.8% |
| Spanish Americans | 3.7 /100 | #231 | Tragic 16.9% |