Immigrants from Korea vs Tlingit-Haida Single Father Poverty
COMPARE
Immigrants from Korea
Tlingit-Haida
Single Father Poverty
Single Father Poverty Comparison
Immigrants from Korea
Tlingit-Haida
15.5%
SINGLE FATHER POVERTY
99.0/ 100
METRIC RATING
89th/ 347
METRIC RANK
15.3%
SINGLE FATHER POVERTY
99.5/ 100
METRIC RATING
78th/ 347
METRIC RANK
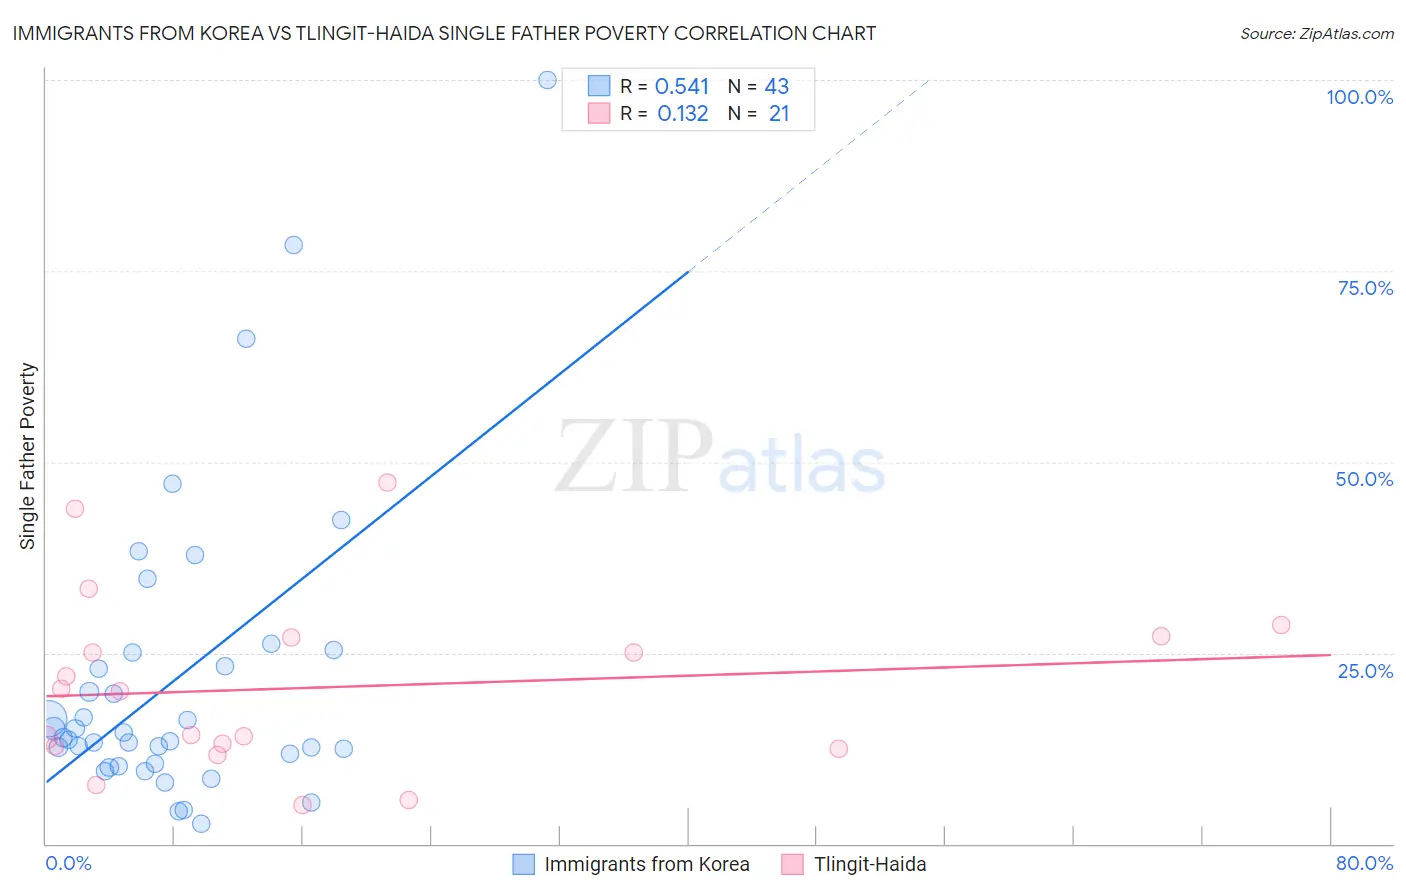
Immigrants from Korea vs Tlingit-Haida Single Father Poverty Correlation Chart
The statistical analysis conducted on geographies consisting of 322,299,273 people shows a substantial positive correlation between the proportion of Immigrants from Korea and poverty level among single fathers in the United States with a correlation coefficient (R) of 0.541 and weighted average of 15.5%. Similarly, the statistical analysis conducted on geographies consisting of 55,978,156 people shows a poor positive correlation between the proportion of Tlingit-Haida and poverty level among single fathers in the United States with a correlation coefficient (R) of 0.132 and weighted average of 15.3%, a difference of 0.84%.
Single Father Poverty Correlation Summary
| Measurement | Immigrants from Korea | Tlingit-Haida |
| Minimum | 2.7% | 5.1% |
| Maximum | 100.0% | 47.4% |
| Range | 97.3% | 42.2% |
| Mean | 21.6% | 20.5% |
| Median | 13.9% | 20.0% |
| Interquartile 25% (IQ1) | 10.5% | 12.6% |
| Interquartile 75% (IQ3) | 25.0% | 27.1% |
| Interquartile Range (IQR) | 14.5% | 14.4% |
| Standard Deviation (Sample) | 19.8% | 11.5% |
| Standard Deviation (Population) | 19.6% | 11.2% |
Demographics Similar to Immigrants from Korea and Tlingit-Haida by Single Father Poverty
In terms of single father poverty, the demographic groups most similar to Immigrants from Korea are Burmese (15.5%, a difference of 0.060%), Brazilian (15.5%, a difference of 0.090%), Immigrants from Russia (15.5%, a difference of 0.10%), Immigrants from Oceania (15.4%, a difference of 0.22%), and Mexican American Indian (15.5%, a difference of 0.23%). Similarly, the demographic groups most similar to Tlingit-Haida are Immigrants from Northern Africa (15.3%, a difference of 0.020%), Immigrants from Peru (15.3%, a difference of 0.050%), Immigrants from Japan (15.3%, a difference of 0.060%), Immigrants from Turkey (15.3%, a difference of 0.14%), and Maltese (15.3%, a difference of 0.16%).
| Demographics | Rating | Rank | Single Father Poverty |
| Kenyans | 99.6 /100 | #73 | Exceptional 15.3% |
| Maltese | 99.6 /100 | #74 | Exceptional 15.3% |
| Immigrants | Turkey | 99.5 /100 | #75 | Exceptional 15.3% |
| Immigrants | Japan | 99.5 /100 | #76 | Exceptional 15.3% |
| Immigrants | Peru | 99.5 /100 | #77 | Exceptional 15.3% |
| Tlingit-Haida | 99.5 /100 | #78 | Exceptional 15.3% |
| Immigrants | Northern Africa | 99.5 /100 | #79 | Exceptional 15.3% |
| Armenians | 99.4 /100 | #80 | Exceptional 15.4% |
| Immigrants | Congo | 99.4 /100 | #81 | Exceptional 15.4% |
| Immigrants | Ukraine | 99.4 /100 | #82 | Exceptional 15.4% |
| Chinese | 99.3 /100 | #83 | Exceptional 15.4% |
| Peruvians | 99.2 /100 | #84 | Exceptional 15.4% |
| Immigrants | Oceania | 99.1 /100 | #85 | Exceptional 15.4% |
| Immigrants | Russia | 99.0 /100 | #86 | Exceptional 15.5% |
| Brazilians | 99.0 /100 | #87 | Exceptional 15.5% |
| Burmese | 99.0 /100 | #88 | Exceptional 15.5% |
| Immigrants | Korea | 99.0 /100 | #89 | Exceptional 15.5% |
| Mexican American Indians | 98.7 /100 | #90 | Exceptional 15.5% |
| Immigrants | Romania | 98.6 /100 | #91 | Exceptional 15.5% |
| Immigrants | Serbia | 98.5 /100 | #92 | Exceptional 15.5% |
| Basques | 98.4 /100 | #93 | Exceptional 15.5% |